
DevOps
Prometheus 3.0: OTLP, Native Histograms, UTF-8 & New UI
July 20269 min read
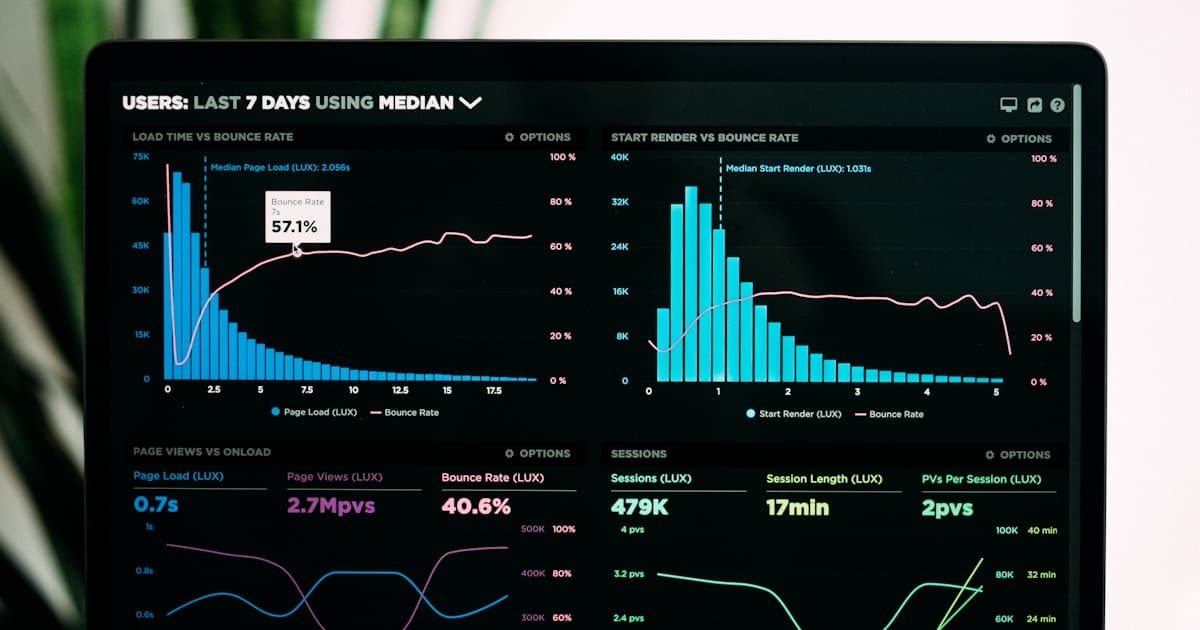
Photo by Luke Chesser on Unsplash
Prometheus 3.0, released in November 2024, is the first major version in seven years. It adds a redesigned web UI with a PromLens-style query tree, full UTF-8 support for metric and label names, a native OTLP receiver for OpenTelemetry data, and Remote Write 2.0. The core TSDB and PromQL engine are unchanged.
Start Prometheus with the --web.enable-otlp-receiver flag, which serves OTLP metrics over HTTP at /api/v1/otlp/v1/metrics. In prometheus.yml, set otlp.translation_strategy to NoUTF8EscapingWithSuffixes so OpenTelemetry dotted names are preserved, and widen storage.tsdb.out_of_order_time_window since OTel pipelines often deliver samples slightly late.
No. In Prometheus 3.0 native histograms are still experimental. You must opt in with --enable-feature=native-histograms, and the on-disk and wire formats can still change. They offer higher resolution at lower storage cost than classic histograms, but I run them in staging and keep classic buckets scraped in parallel.
Upgrade to 2.55 first because a rollback from 3.0 only works back to 2.55. Regex dots now match newlines, range selectors became left-open and right-closed, histogram le and quantile labels are normalized to float form, scraping fails without a valid Content-Type header, and logging switched from go-kit fields to slog.
Yes. Prometheus 3.0 ships a redesigned UI built on the PromLens work with a query tree view, but the legacy interface is still reachable behind the old-ui feature flag for now. Plan to migrate off it, since the new UI is the supported path and renders UTF-8 metric names correctly.
Photo by Luke Chesser on Unsplash
Key Takeaway
Prometheus 3.0, released in November 2024, is the first major version in seven years. It ships a redesigned web UI with a PromLens-style query tree, full UTF-8 support for metric and label names, a native OTLP receiver for OpenTelemetry data, and Remote Write 2.0. Upgrading from 2.x brings several breaking changes worth planning for.
I have run Prometheus in production since the 2.x days, so when the team announced version 3.0 in November 2024 — the first major release in seven years — I read the notes carefully before touching a single server. The headline is that 3.0 is not a rewrite. It is the same battle-tested TSDB and PromQL engine, with a modernized UI and a batch of features that were experimental for years finally becoming production-ready.
That is also the trap. Several things that used to live behind feature flags are now on by default, and a few behaviors changed in ways that will quietly break dashboards and recording rules if you upgrade without reading. This post walks through what is genuinely new and useful, then the breaking changes I check for before rolling 3.0 into any cluster.
The most visible change is the web UI. The old expression browser was functional but dated; the new one adopts work from PromLens, including a tree view that breaks a PromQL query into its parsed structure so you can see exactly how each part evaluates. It also renders UTF-8 metric names correctly and generally feels like a modern app. If something in your workflow depends on the old interface, the legacy UI is still reachable behind the old-ui feature flag for now.
For years Prometheus restricted metric and label names to a limited ASCII character set, which meant OpenTelemetry names full of dots got those dots rewritten to underscores. In 3.0, all valid UTF-8 characters are allowed in names by default. The cost is a small syntax change: to select a metric whose name is not a legal identifier, you use a new quoted form inside the selector, or spell out the name label yourself.
# In 3.0, a metric name can contain dots, slashes, and other UTF-8.
# PromQL adds a new quoting syntax to select such names:
{"my.custom.metric", job="api"}

# ...which is equivalent to spelling out __name__ explicitly:
{__name__="my.custom.metric", job="api"}Prometheus 3.0 can act as a native receiver for the OTLP metrics protocol, so an OpenTelemetry Collector can push straight into it with no sidecar exporter. You turn the receiver on with a command-line flag, and it then accepts OTLP over HTTP at the OTLP metrics endpoint. I pair it with the NoUTF8EscapingWithSuffixes translation strategy so OTel names keep their dots, and I widen the out-of-order window because OTel pipelines frequently deliver samples slightly late.
# Start Prometheus with the OTLP receiver turned on.
# It then serves OTLP metrics at /api/v1/otlp/v1/metrics
prometheus --web.enable-otlp-receiver

# prometheus.yml — recommended OTLP settings for OTel data
otlp:
  # Keep UTF-8 names instead of rewriting dots to underscores
  translation_strategy: NoUTF8EscapingWithSuffixes

storage:
  tsdb:
    # OTel pipelines often push slightly out of order
    out_of_order_time_window: 30m
The OTLP receiver is disabled by default on purpose. Prometheus can run with no authentication, so an open write endpoint would let anyone inject metrics. Put it behind a reverse proxy or network policy before you expose it, exactly as you would the remote-write receiver.
Native histograms are the feature I am most excited about and the one I am slowest to adopt in production. Instead of pre-defining fixed buckets, they use exponential buckets that adapt automatically, giving far higher resolution at a fraction of the storage and cardinality cost of classic histograms. In 3.0 they remain experimental: you opt in with a feature flag, the on-disk and wire formats can still change, and the tooling around them is incomplete. I run them in staging and keep classic buckets scraped in parallel.
# Native histograms are still EXPERIMENTAL in 3.0 — opt in explicitly.
prometheus --enable-feature=native-histograms

# During migration you can keep scraping the classic buckets too.
# (this option was renamed from scrape_classic_histograms in 3.0)
scrape_configs:
  - job_name: api
    always_scrape_classic_histograms: true
Remote Write 2.0 is a new version of the protocol that carries everything a remote-write target long wanted in one payload: metric metadata, exemplars, created timestamps, and native histograms all travel together. It also uses string interning to deduplicate repeated label strings, which cuts both payload size and CPU on busy senders. It is negotiated automatically, so a 3.0 sender falls back to 1.0 when the receiver does not speak 2.0 yet.
None of this is free. Before I move a cluster to 3.0 I walk this checklist, because these are the changes that tend to break silently rather than loudly:
Scraping is stricter in 3.0. If a target serves metrics without a valid Content-Type header, the scrape now fails instead of being guessed. Set fallback_scrape_protocol in the scrape config for legacy exporters, and watch the logs — which also switched from go-kit fields to slog, so any log parser keyed on the old ts and caller fields needs updating to the new time and source fields.
| Area | Prometheus 2.x | Prometheus 3.0 |
|---|---|---|
| Web UI | Legacy expression browser | Redesigned UI with a PromLens-style query tree |
| Metric and label names | ASCII only; dots rewritten to underscores | Full UTF-8 allowed by default |
| OTLP ingestion | Not built in | Native OTLP receiver on a dedicated HTTP endpoint |
| Remote write | Protocol 1.0 | Remote Write 2.0 with metadata, exemplars, native histograms |
| Native histograms | Experimental opt-in | Still experimental opt-in |
| Log format | go-kit fields, ts and caller | slog fields, time and source |
My advice after running the upgrade: treat 3.0 as low-risk on the engine and high-attention on the edges. The storage and query core are the same code you already trust, so the migration itself is fast. The work is in the details — the regex and range-selector semantics, the label normalization, the stricter scraping — so read the official migration guide end to end, upgrade to 2.55 first, and roll it out one cluster at a time.