

Key Takeaway
Threads reports 400 million monthly active users and lists Indonesian among its supported languages, while X publishes no active-account figure at all. Neither number tells you where your own technical writing gets read. Tag every shared link with utm_source, publish to both platforms for a fixed period, and let your own analytics decide.
I publish every post here in two languages, and for a while I shared each one to Threads and to X within the same five minutes, with the same link. Then someone asked which platform was actually worth the effort, and I realised I had made that impossible to answer. Both links were identical, so my analytics had one row where it needed two.
This post compares Threads and X as distribution channels for technical writing aimed at an Indonesian audience. Everything stated here as a platform fact comes from the platforms' own documentation and is cited at the foot of the page. Everything about reach — mine or yours — is a measurement I describe how to run, because neither platform hands an outsider the data that would settle it.
One Platform Publishes a Number, the Other Does Not
Start with the only figure that looks comparable, and notice that it is not. Threads was reported at 400 million monthly active users in August 2025 and lists Indonesian among 31 supported languages. X has published no active-account figure since it went private; the numbers in circulation, such as 600 million monthly active users in May 2024, are statements by the owner rather than reported results, and the reference literature says plainly that estimates vary because the company does not publish statistics on active accounts.
That asymmetry matters more than the gap between the numbers. A figure you cannot audit is not evidence in a decision, it is a talking point. And even the audited one is the wrong shape for the question: 400 million monthly active users worldwide says nothing about how many Indonesian developers read a post about NestJS interceptors on a Tuesday morning.
So I stopped treating size as the interesting axis. The useful published facts are mechanical ones — how long a post can be, how many links it may carry, what an API call costs, which metrics you can pull back out. Those are documented, dated and checkable, and they change what you can build on top of each platform.
Six Axes Where the Two Genuinely Differ
Here is what is actually published about each platform, restricted to the axes that change how a technical post behaves. Every cell traces to a source at the foot of this post, and where a platform publishes nothing the cell says so rather than filling the gap with an estimate.
| What differs | Threads | X |
|---|---|---|
| Published audience size | 400 million monthly active users, reported August 2025 | Nothing reported since the company went private; 600 million monthly active users in May 2024 is an owner statement |
| Indonesian availability | Indonesian is one of 31 supported languages; no country breakdown published | Nothing published about language or country composition |
| Post length | 500 characters per post, for everyone; longer arguments are chained | 280 characters as standard; up to 4,000 characters for paying subscribers since 2023 |
| Links inside a post | Up to 5 links; the first one becomes the link attachment | Links are permitted, and posting one through the API is priced separately from posting without one |
| Write API access | 250 posts, 1,000 replies and 100 deletions per profile per rolling 24 hours | Pay-per-usage credits with no free tier documented: $0.015 per post, $0.200 per post with a URL |
| Reading your own numbers back | Insights API returns views, likes, replies, reposts, quotes, shares and profile clicks, with no history before 13 April 2024 | Post reads are billed at $0.005 each, capped at 3 million per monthly billing cycle |
Read the last two rows together and the practical difference is not reach, it is the cost of instrumentation. On Threads, publishing a post and then asking how it did is two free API surfaces. On X the same loop has a price list attached, and the line that stings is the one charging thirteen times more for a post that contains a link — which is every post that points at an article.
The Link Question, and Which Half of It Is Folklore
Every discussion of technical writing on X arrives at the same claim: links get suppressed. I cannot verify that and neither can you, because ranking behaviour is not published and a dip in your own reach has a dozen explanations before it needs an algorithm. What I can point at is a published number sitting next to it that is often mistaken for it. X's own price list charges $0.015 to create a post and $0.200 to create a post with a URL.
That is a fact about billing, not about the timeline. It tells you what automated link posting costs; it says nothing about what a link does to distribution. Threads documents its side differently: a text post may carry up to five links, and the first link in the post becomes the link attachment. That is a formatting rule rather than a ranking rule, and it has one practical consequence — put the canonical URL first, because anything you list after it will not get the preview card.
Do not turn the $0.200 API price into a claim about reach. It is what X bills for one automated post containing a URL, and nothing more. Presenting a billing line as evidence of algorithmic suppression is the exact move that makes platform comparisons untrustworthy, and it is the move I nearly made in the first draft of this post.
Format: 500 Characters, Chained, Against One Long Post
A technical argument rarely fits in a preview. The question is what each platform makes you do about that, and the two answers differ genuinely rather than cosmetically.
- Threads caps every post at 500 characters for everyone, so a longer argument becomes a chain — each link in the chain is a separate object with its own metrics, and a reader can drop out between any two of them.
- X gives 280 characters by default and up to 4,000 to paying subscribers, so the same argument can be one object that is read or ignored as a unit.
- Both mean the first two lines carry the whole post. Everything after them is read mainly by people you have already convinced.
In practice I stopped writing chains. A chain is a bet that the reader keeps tapping, and when the real payload is a 2,000-word article the chain competes with the article for the same attention. One paragraph that states the finding, plus one link, has been easier to write, easier to translate and far easier to measure — which is what this post is really about.
What Happens After the First Hour
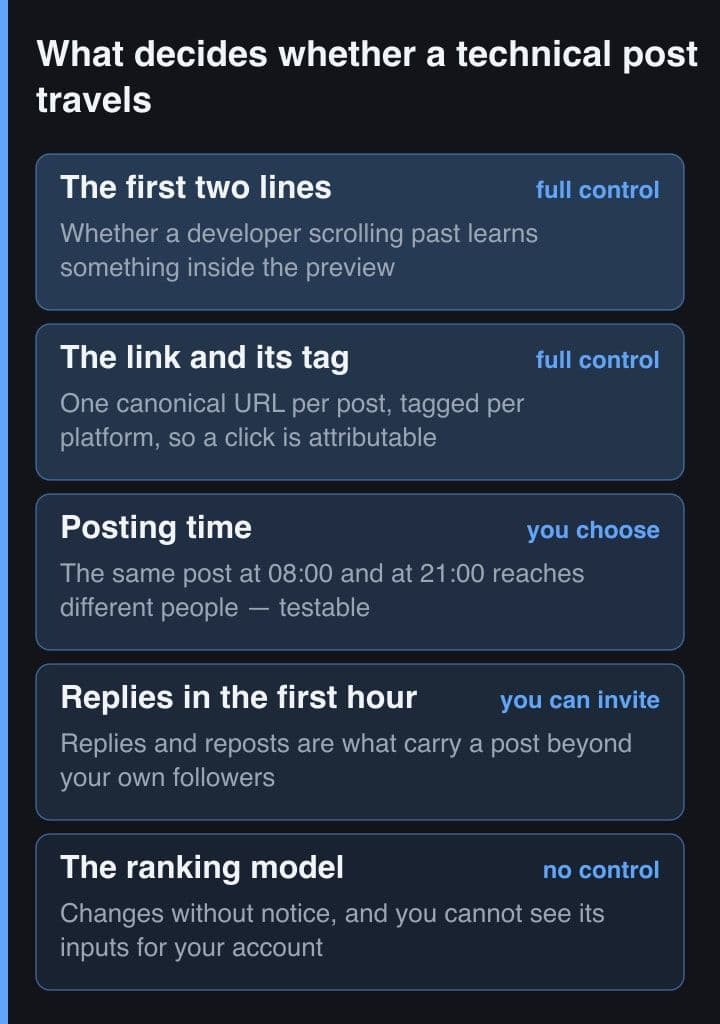
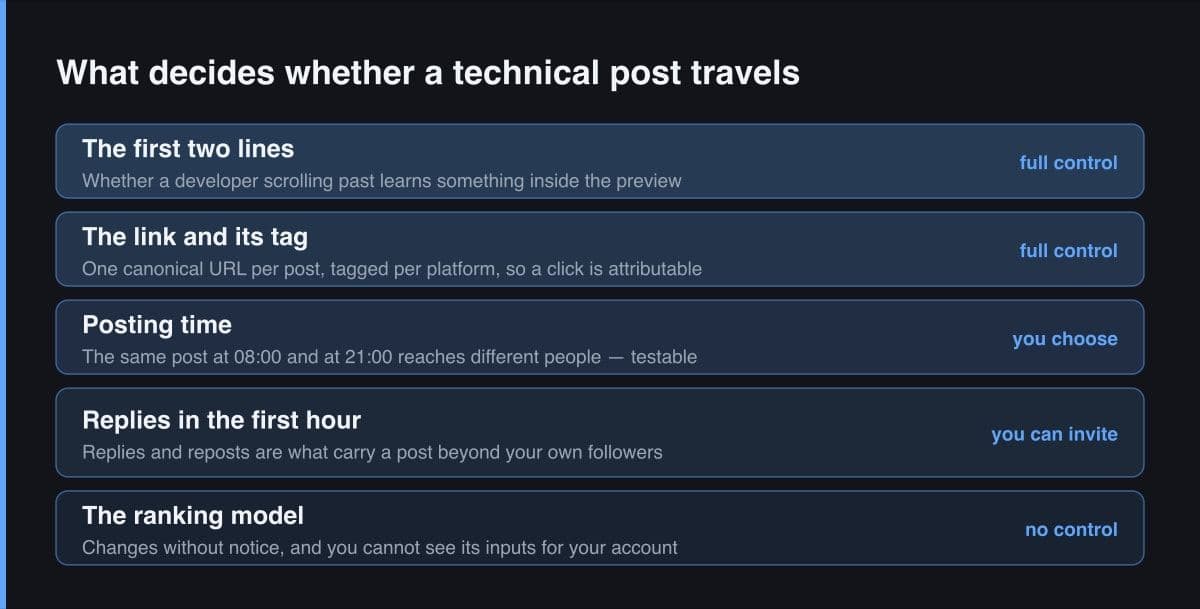
This is the axis I most wanted data on and have the least of. Both platforms decide early: a post gathers most of its impressions in a short window after publication, and what happens inside that window — whether anyone replies, whether anyone reposts — decides whether it leaves your own follower graph at all. The shape of that decay, and the true size of the window, is not something either platform publishes.
So I treat it as a variable I control rather than a constant I look up. Posting time is entirely mine to choose, and the same post at 08:00 Jakarta time and at 21:00 reaches different people whether or not a ranking model is involved. Replies are partly mine to invite. In my own posting, a post ending with a real question draws a first reply far more often than one ending with a link — which is an impression, not a measurement, and it is on the list of things I am now instrumented to check.
Cross-Posting, and What the Two APIs Cost
Publishing in two languages means writing four social posts per article, so automation stops being optional quickly. Here the two platforms diverge sharply, and the divergence is documented rather than inferred.
// Cross-posting one blog link to both platforms. The shapes differ more than
// the code does: Threads is two calls and a documented daily ceiling, X is one
// call and a documented per-request price.

const THREADS_BASE = "https://graph.threads.net/v1.0/";

// 1. Create the container. Text posts cap at 500 characters, and the API
//    accepts up to 5 links — the FIRST one becomes the link attachment, so
//    put the canonical URL first and the reading list afterwards.
const create = await fetch(
  THREADS_BASE + threadsUserId + "/threads?" +
    new URLSearchParams({
      media_type: "TEXT",
      text: summary + "\n\n" + taggedUrl,
      access_token: threadsToken,
    }),
  { method: "POST" },
).then((r) => r.json());

// 2. Publish it. Counted against 250 posts / 1,000 replies per profile
//    per rolling 24 hours — check GET /threads_publishing_limit before a batch.
await fetch(
  THREADS_BASE + threadsUserId + "/threads_publish?" +
    new URLSearchParams({ creation_id: create.id, access_token: threadsToken }),
  { method: "POST" },
);

// X is one call, but the published price list bills the two cases separately:
//   Post creation ......... $0.015
//   Post with URL ......... $0.200   <- the same post, with a link, is 13x
// Budget for the link, not for the post.
await fetch("https://api.x.com/2/tweets", {
  method: "POST",
  headers: {
    Authorization: "Bearer " + xToken,
    "Content-Type": "application/json",
  },
  body: JSON.stringify({ text: summary + " " + taggedUrl }),
});
The Threads side is rate-limited but free at the point of use, and it exposes a publishing-limit endpoint so a batch job can check its remaining quota before it starts instead of discovering the ceiling halfway through. The X side documents no free tier: it is pay-per-usage credits, capped at three million post reads per monthly billing cycle, and the write price separates a plain post from a post carrying a URL. For a personal blog the absolute amounts are small. The point is that one platform's automation is a rate-limit problem and the other's is a budget line, and that difference decides how you build the job.
The Measurement You Can Actually Run
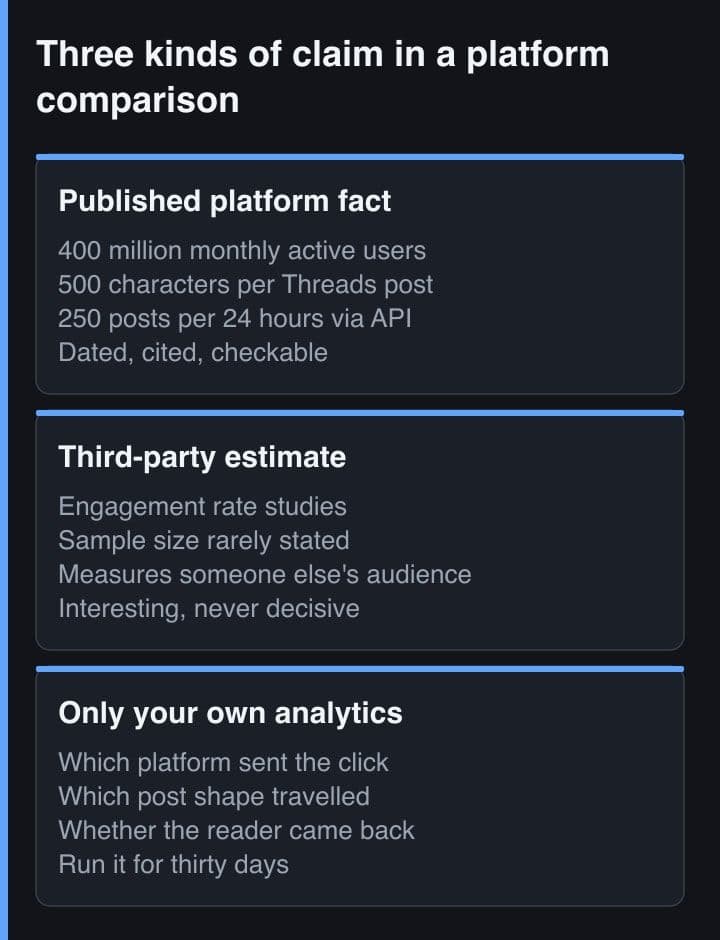
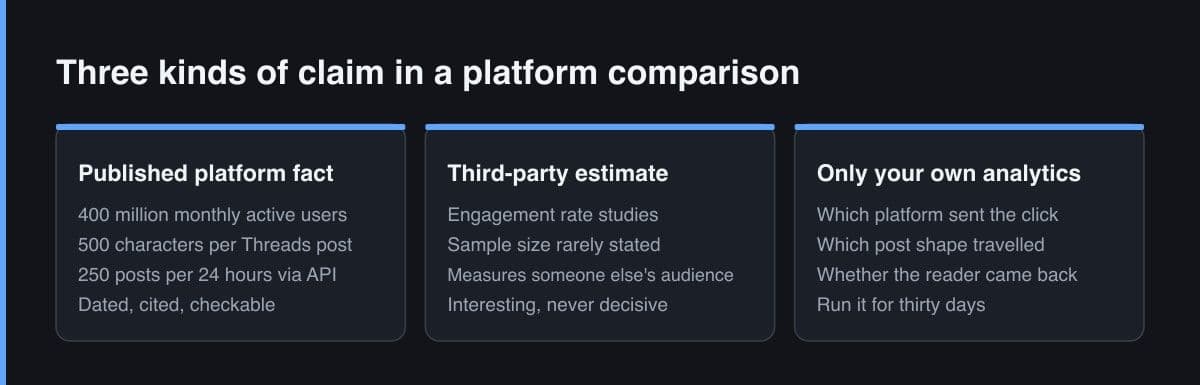
Everything above is context. This is the part that answers the title, and it only answers it for one person at a time. Tag the link, publish to both platforms for a fixed period, and read your own analytics. The tagging is the whole trick, because referrer data coming from a mobile in-app browser is unreliable and both platforms open links in one.
// Never type utm_source by hand. One capital letter — "X" instead of "x" —
// splits the channel into two rows in GA4, and you lose an evening looking
// for the half of the traffic that was never missing.

const CHANNELS = ["threads", "x"] as const;
type Channel = (typeof CHANNELS)[number];

const SITE = "https://www.matthewswong.com";

export function shareUrl(slug: string, locale: "en" | "id", ch: Channel) {
  const url = new URL("/" + locale + "/blog/" + slug, SITE);
  url.searchParams.set("utm_source", ch);        // threads | x
  url.searchParams.set("utm_medium", "social");  // constant, so the two rows sort together
  url.searchParams.set("utm_campaign", slug);    // the post, so it compares with itself
  url.searchParams.set("utm_content", locale);   // which language pulled the click
  return url.toString();
}

shareUrl("threads-vs-x-developer-audience-indonesia", "id", "threads");
// https://www.matthewswong.com/id/blog/threads-vs-x-developer-audience-indonesia
//   ?utm_source=threads&utm_medium=social
//   &utm_campaign=threads-vs-x-developer-audience-indonesia&utm_content=id
Then run it as an experiment rather than as a habit:
- Fix the window before you start — thirty days, or twenty posts per platform, whichever takes longer. Deciding when to stop after seeing the numbers is how you conclude whatever you already believed.
- Post the same article to both platforms within the same five minutes, with the same summary text, so the only deliberate difference is the value of utm_source.
- Log every post to a file at the moment you publish it. Sessions without a post count is a numerator with no denominator.
- Read sessions and engaged sessions by utm_source over exactly that window, then divide each by the number of posts published on that platform.
- Look at what happened after the click — pages per session, or whether anyone came back — before deciding a platform sends better readers rather than simply more of them.
# One line per published post, appended the moment you press post.
# Without this file the analytics rows have no denominator: 40 sessions from
# Threads means nothing until you know it came from 12 posts, not 2.
# posts.csv
date,slug,locale,channel,posted_at_wib,shape,first_line_chars
2026-09-19,threads-vs-x-developer-audience-indonesia,id,threads,08:05,single,118
2026-09-19,threads-vs-x-developer-audience-indonesia,id,x,08:05,thread,131
2026-09-21,duckdb-in-process-analytics,en,threads,21:40,single,96
2026-09-21,duckdb-in-process-analytics,en,x,21:40,single,96

# Then read sessions by utm_source in GA4 over the same window, and divide.
# Anything under about twenty posts per platform is an anecdote, not a result.
Two honest caveats. Twenty posts per platform is a small sample and one popular article will dominate it, so read the median post rather than the total. And the answer expires: it describes those thirty days, on that account, with those posts, not the platforms in general. I re-run it rather than quoting my own old result, which is also why this post hands you the method instead of my numbers.
Set utm_medium to the same value on both platforms and utm_campaign to the post slug. One analytics view then answers both questions you actually have — which platform sent more readers, and which post travelled — without building a second report.
There is no winner here, and a post that named one would be selling you its own guess. What is published genuinely differs: Threads gives you a reported audience figure, a 500-character ceiling, five links per post and a free insights endpoint, while X gives you a longer post for a subscription, no audience figure at all, and a price list where the link costs more than the post around it. Everything else, including the question in the title, is a thirty-day experiment with utm_source on the end of every link.
Sources
- Threads API — Posts: the 500-character text limit, the five-link rule and the 250-post publishing ceiling
- Threads API — Insights: the media and user metrics available, and the April 2024 history floor
- X API — Pricing: pay-per-usage credits, post creation against post with URL, and the read cap
- Wikipedia — Threads: 400 million monthly active users and the 31 supported languages
- Wikipedia — X: post length limits and the absence of published active-account statistics
- Google Analytics Help — Collect campaign data with custom URLs, the utm parameter reference