I'm pursuing a unique path that blends technology with entrepreneurship. My studies focus on building technical expertise while developing the business acumen to turn innovative ideas into real-world solutions.
Beyond academics, I actively participate in campus organizations where I've developed leadership skills, creative direction, and event management experience.
Campus Life
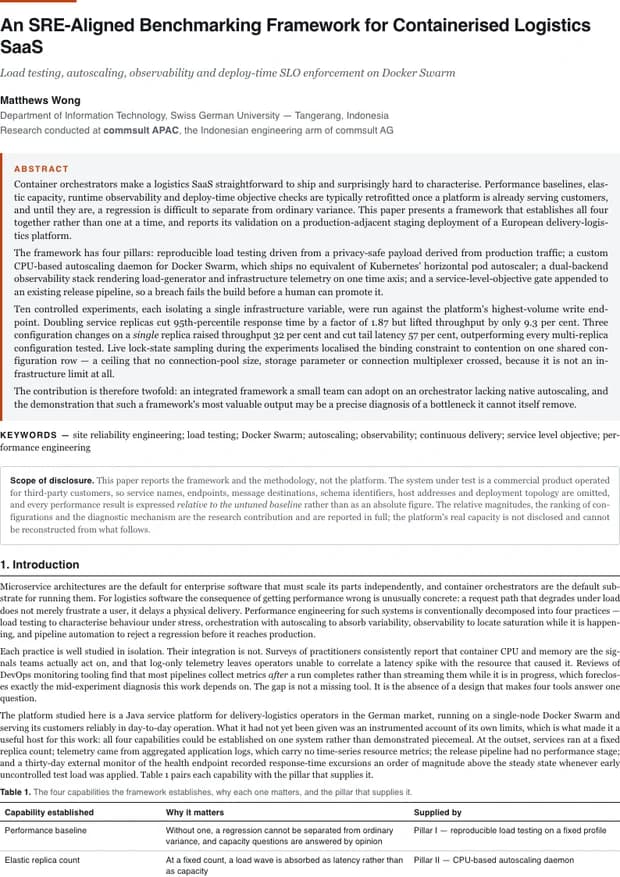
Ontego Traces, a logistics platform used by German delivery operators, ran in production with no performance baseline and no way to detect service degradation under load. My thesis built an SRE-aligned benchmarking framework and ran ten controlled experiments against its highest-volume write path — to find where it actually breaks, and prove which fixes matter.
Each bar is a real k6 run under identical load, shown relative to the untuned baseline. The tuned single replica wins both metrics — beating the two-replica configurations it was supposed to lose to.
The instinct is to scale out. But tuning the database on one replica delivered more throughput and lower latency than adding a second — because the real bottleneck was never CPU.
A live pg_stat_activity trace revealed the hard limit: every write request contends for the same shared configuration row, serialising all concurrent writes. It's the last rung of the bottleneck ladder — an application-level fix, not an infrastructure one.
Adding a second replica improved tail latency but lifted throughput by under 10%. Horizontal scaling only pays off when CPU is the constraint — and here it wasn't.
Disabling synchronous commit, enlarging the page cache and widening the connection pool beat two-replica scaling on every metric — from a single machine.
A live database trace exposed a single shared row serialising every write. No replica count or connection proxy can remove a row-level lock — only an application change can.
The four SRE golden signals on Grafana turned latency spikes from guesswork into a diagnosis, pointing straight at the layer that was actually saturated.
Reproducible k6 experiments with a fixed, staged methodology — the first performance baseline the platform ever had.
A Docker Swarm daemon that scales the busiest service between one and three replicas on CPU and queue-depth signals, with cooldown.
Prometheus + Grafana capturing all four golden signals, federated across two VMs so app metrics survive under load.
A pipeline check that blocks production deploys when tail latency or error rate breach an agreed threshold.