

Key Takeaway
PaaS autoscaling multiplies database connections: replica count times pool size, plus the migration job, background workers and the psql session you open to diagnose it. PostgreSQL defaults to 100 max_connections and reserves three for superusers, so the wall arrives on an autoscale rather than a deploy. Size each pool down, or run PgBouncer in transaction mode.
The deploy was green. The health check passed, the smoke test passed, and the service ran for two days without a single database error in the logs. Then traffic climbed, the platform did exactly what it had been configured to do and added replicas to meet it, and the newest replicas began failing their very first query with a message the older ones had never produced: sorry, too many clients already.
Nothing had been deployed. Nothing had been changed. The only thing that moved was a replica count, and it moved a number that lives in two places at once and is owned by neither of them. This post is the arithmetic that predicts that failure, why a Postgres connection is expensive enough to make the ceiling low, and the options for raising it. Every parameter name and default below comes from the PostgreSQL and PgBouncer documentation linked at the end; the worked totals are a scenario built from those defaults, not a measurement of one particular outage.
Deploys are safe, autoscales are not
A deploy replaces replicas; an autoscale adds them. That single difference is why connection exhaustion is the failure that gets through staging and through the release checklist. A rolling update keeps the replica count roughly constant while it swaps containers, so the demand your application places on the database at the end of the release is the same demand it placed at the start. Nothing in that process asks the database for anything it was not already giving you yesterday.
An autoscale changes the multiplier. The platform reads a CPU or request-rate target, decides it needs eight copies of your container instead of two, and starts them. Each copy runs identical code, reads the same DATABASE_URL and builds the same connection pool with the same max, because that number lives in your application and your application has no idea how many copies of itself exist. The ceiling on the other side, meanwhile, was fixed at server start by a value somebody set without ever being told what your autoscaler ceiling would be.
The formula, worked against the defaults
The whole failure is one sum with a supply side and a demand side. Supply is max_connections minus the slots the server refuses to hand an ordinary role. The documentation gives max_connections a typical default of 100, superuser_reserved_connections a default of three, and reserved_connections a default of zero, and it is explicit that once free slots fall to the reserve, new connections are accepted only for superusers. So the number your application can actually reach is 97, not 100, and a small managed plan often sets a lower ceiling than the default in the first place.
# SUPPLY — both values are PostgreSQL defaults.
max_connections                  = 100
superuser_reserved_connections   =   3   # never handed to an ordinary role
reserved_connections             =   0
                                   ---
usable by your application role   =  97

# DEMAND at peak. None of this is a steady state: a pool opens sockets lazily,
# so "8 replicas x 10" only materialises when all eight are genuinely busy —
# which is the exact condition that made the autoscaler create them.
  web replicas        8  x  pool max 10   =  80
  worker replicas     2  x  pool max  5   =  10
  release migration   1  x  pool max  5   =   5
  cron / one-off      2  x           1    =   2
  your own psql session                   =   1
                                            ---
                                             98   >  97   ->  FATAL

# Re-run it at four web replicas and the total is 58. Everything is fine.
# The deploy did not change the multiplier, so the deploy was green.
# The autoscale changed it, and nothing in the autoscale looked at this sum.
Two properties of that sum are worth dwelling on. The demand side is a ceiling rather than a steady state, because a pool opens sockets lazily: the full eight-times-ten only materialises when all eight replicas are genuinely busy, which is precisely the condition that made the autoscaler create them. And the total crosses 97 somewhere between four replicas and eight, so there is a replica count at which everything is fine and a slightly larger one at which it is not, with no gradual degradation in between to warn you.
The failure is asymmetric, and the asymmetry is what turns a bad minute into an outage. Replicas that already hold connections keep serving. New replicas cannot get one, so they fail their readiness check, so the platform never routes traffic to them, so measured load per ready replica stays high, so the autoscaler asks for more replicas, each of which also fails to connect. The scale-up feeds the thing that is breaking it, and the graph you are staring at shows demand rising and healthy capacity flat.
Why the ceiling is 100 and not 100,000
A Postgres connection is not a socket with a row in a table, and that is the reason the number is small enough to run out of. The architecture chapter of the documentation is unambiguous: the server handles multiple concurrent connections by forking a new process for each one, after which the client and that dedicated backend process talk without the supervisor's involvement. Every connection is therefore an operating-system process with its own address space, its own file descriptors and its own claim on the scheduler.
The cost does not stop at the running process either, and this is the half that makes the parameter awkward to raise. The max_connections entry notes that PostgreSQL sizes certain resources directly from that value, shared memory among them, so the allocation is made at server start whether or not anybody ever connects. Raising the ceiling therefore spends memory on an idle server, and every slot you actually use spends a process on a busy one. A limit of 100 is not the platform being stingy; it is the shape of the engine.
The connections nobody counts
Once the arithmetic is written down, the interesting question stops being how big your pool is and becomes what else is holding a connection at the same instant. Every setup I have worked through had at least one holder that was in nobody's estimate, and it was never the web tier, because the web tier is the one everybody remembers.
The release migration job is the sharpest of them, because it runs during a deploy, which is when the pool is already warm and traffic is already being shifted. Background workers are usually a separate deployment with a separate pool and their own autoscaler, so they multiply independently of the web tier and on a different trigger. Cron and one-off tasks hold connections for a few seconds at a time and vanish inside any dashboard averaged over a minute. Metrics exporters and backup agents hold one each, permanently. And the last one is the session you open yourself, with psql, to find out why the service is down.
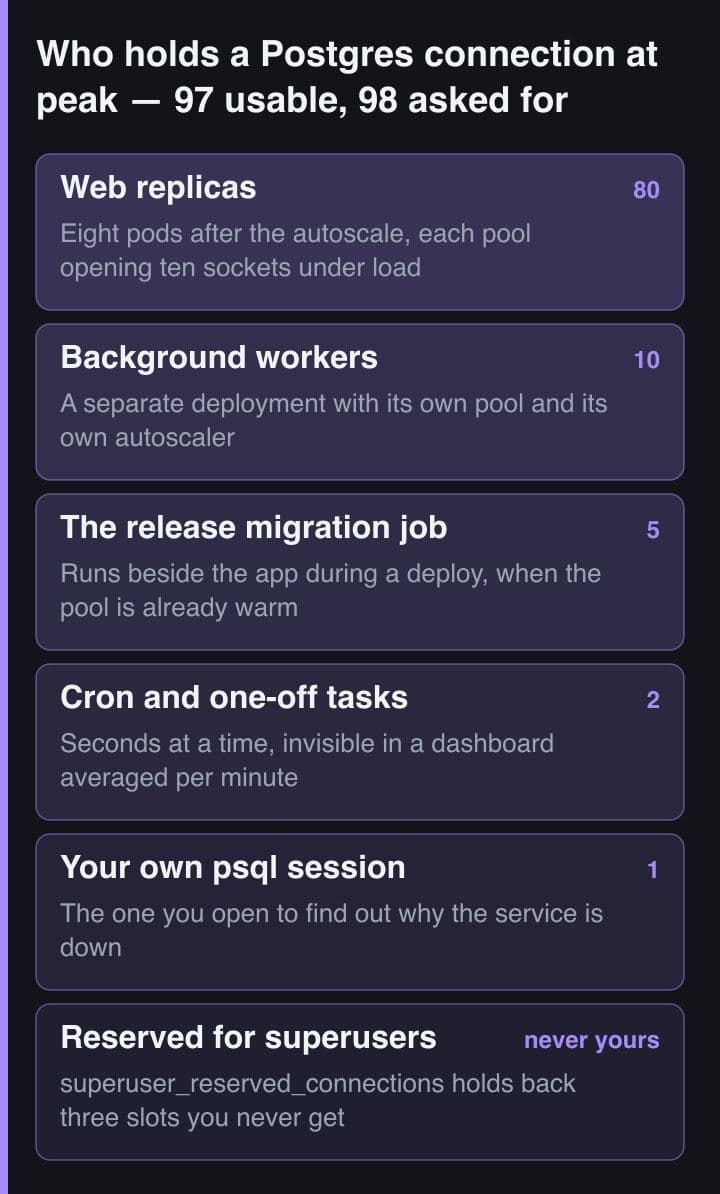
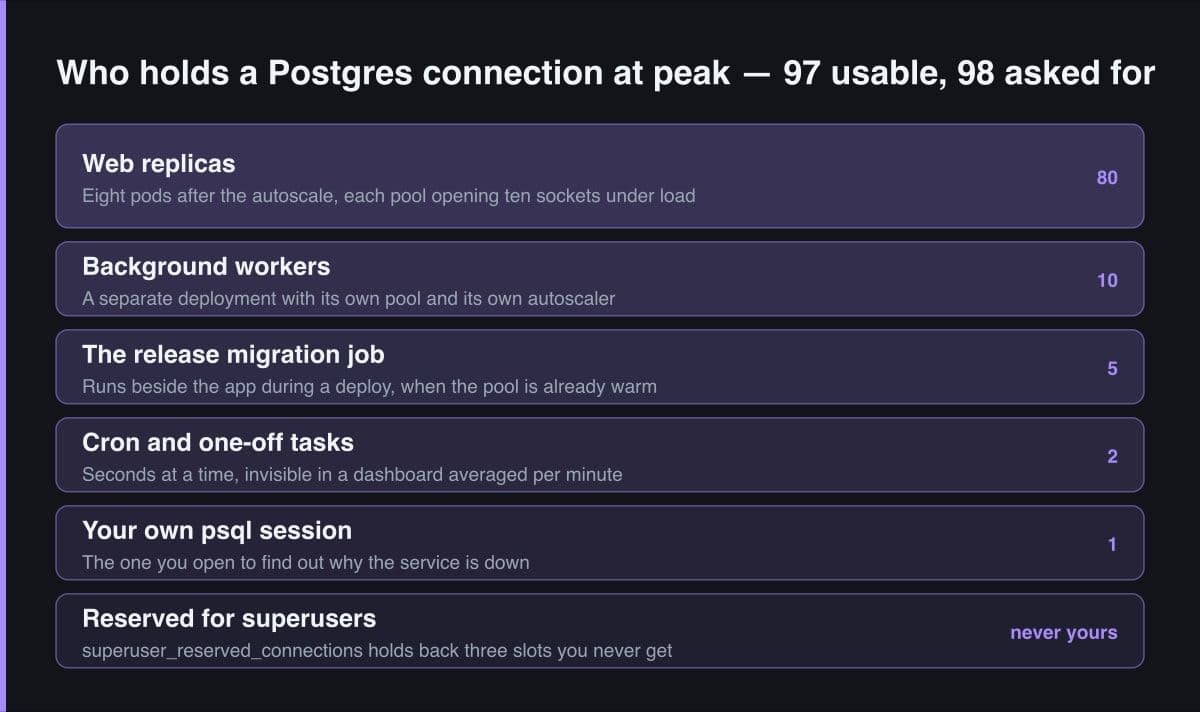
Set a distinct application_name in every service's connection string — the web app, the workers, the migration job, your own psql. It costs one query parameter and turns pg_stat_activity from a count into an answer. Instead of ninety-eight connections you get eighty from web, ten from worker and five from migrate, which tells you immediately which number to change.
Size the pool down, not up
The instinct when a pool starves is to raise its max. On a PaaS that is backwards, because the scarce resource is the database and not the application. You can run ten copies of your container; there is one Postgres, and its process-per-connection model means additional backends compete for the same cores and the same memory rather than adding capacity. The correct move is to divide a fixed budget by the autoscaler's ceiling and accept a small pool per replica.
- Write down the budget: max_connections minus superuser_reserved_connections, minus everything that is not a web replica — workers, the migration job, cron, exporters, and one slot for a human with psql.
- Divide that budget by maxReplicas, not by the replica count you happen to be running today. The autoscaler's ceiling is the only figure the arithmetic can safely assume.
- Floor the result at two. If the honest answer is one, the database plan is too small for that replica ceiling and one of the two has to change — that is a decision, not a config value.
- Set a connection-acquisition timeout so a starved pool fails fast and locally instead of queueing for ever, and log every timeout. That log line is your early warning the next time the multiplier moves.
// Wrong: the pool that was right when this ran as one container.
const pool = new Pool({
  connectionString: process.env.DATABASE_URL,
  max: 10,
});
// Nothing in this file knows the platform may run ten copies of it. The number
// that actually reaches Postgres is 10 * replicas, and "replicas" is set in a
// dashboard by whoever configured autoscaling.

// Right: derive the per-replica ceiling from a shared, written-down budget.
const CONNECTION_BUDGET = 78; // 97 usable, minus workers, migration and one psql
const MAX_REPLICAS = 10; // the SAME value as the autoscaler ceiling

const pool = new Pool({
  connectionString: process.env.DATABASE_URL,
  max: Math.max(2, Math.floor(CONNECTION_BUDGET / MAX_REPLICAS)), // 7

  // Queue locally rather than failing remotely. A request that waits 40 ms for
  // a pool slot is slow; a request that gets "too many clients already" is a
  // 500. This timeout is the only place you can choose which one happens.
  connectionTimeoutMillis: 5000,
  idleTimeoutMillis: 30000,
});
A small pool moves the queue out of the database and into the application, which is where you want it. Waiting for a pool slot is a bounded, measurable delay inside a process you control, with a timeout you chose and a metric you can graph. Waiting for a connection slot on the server is not waiting at all: the server refuses, the driver throws, and the request becomes a 500. Queueing beats failing, and your pool is the only place you can queue deliberately.
A pooler multiplies the ceiling by breaking session semantics
PgBouncer's real contribution is that a client connection and a server connection stop being the same object. max_client_conn, the number of clients the pooler will accept, defaults to 100 and costs roughly two kilobytes each. default_pool_size, the number of server connections it will open per user and database pair, defaults to 20. Only the second number is spent against max_connections. That is the whole multiplier: many application clients sharing a small, fixed set of backends.
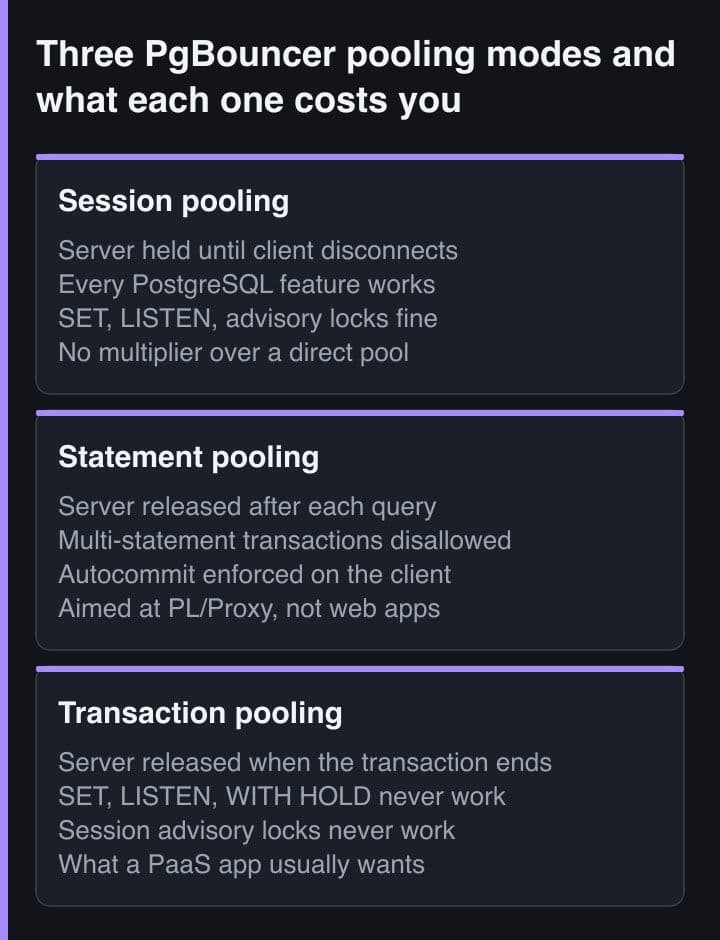
You only get the multiplier in the right pool_mode, and the default is not it. pool_mode defaults to session, which holds a server connection for as long as the client stays connected — it supports every PostgreSQL feature and gives you no more concurrency than connecting directly. Transaction mode releases the server the moment the transaction ends, and the PgBouncer documentation is blunt about the price: the mode breaks client expectations of the server by design, and can be used only if the application cooperates by not using the features that break.
[databases]
appdb = host=db.internal port=5432 dbname=appdb

[pgbouncer]
listen_port = 6432

; Default is "session", which holds a backend for the whole client connection
; and therefore gives you no more concurrency than connecting directly.
pool_mode = transaction

; Clients PgBouncer will ACCEPT. Costs about 2 kB each. Default: 100.
max_client_conn = 1000

; Server connections PgBouncer will OPEN, per user/database pair.
; THIS is the number that counts against max_connections. Default: 20.
default_pool_size = 20

; A client with no server assigned within this window is disconnected rather
; than queued for ever. Default: 120.0 seconds — so "errors at exactly two
; minutes" is a pool-starvation signature, not a network one.
query_wait_timeout = 120

; Default 200 since PgBouncer 1.24.0; it was 0 from 1.21.0, when protocol-level
; prepared statement support was introduced. Zero means no support in
; transaction mode at all.
max_prepared_statements = 200
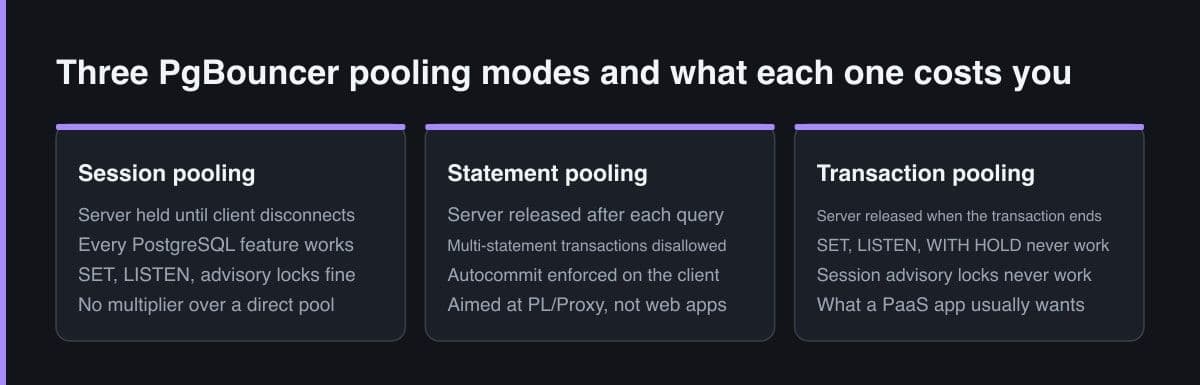
In transaction pooling the PgBouncer feature map lists SET and RESET, LISTEN, WITH HOLD cursors, PRESERVE and DELETE ROWS temp tables, session-level advisory locks and SQL-level PREPARE as Never — not degraded, never. NOTIFY, ON COMMIT DROP temp tables and WITHOUT HOLD cursors still work. The full mode-by-mode table has a post of its own on this site:
PgBouncer Pooling Modes: Session vs Transaction vs Statement
The prepared-statement problem, and why the answer moved
Prepared statements are the one entry on that list most applications hit without ever choosing to, because drivers and ORMs use them by default. What decides whether they survive transaction pooling is protocol-level versus SQL-level. A driver using the extended query protocol sends a named Parse, and PgBouncer can track that: it rewrites your statement name to an internal one, prepares it on whichever backend you were assigned, and re-prepares it transparently when the next transaction lands somewhere else. SQL-level PREPARE, EXECUTE and DEALLOCATE are forwarded straight through with no tracking at all, which is why the feature map marks them Never.
-- WORKS in transaction pooling: protocol-level named prepared statements.
-- The driver sends a named Parse over the extended query protocol. PgBouncer
-- renames it internally to PGBOUNCER_<unique id>, prepares it on whichever
-- backend you were assigned, and re-prepares it transparently when the next
-- transaction lands on a different one.
--   node-postgres: client.query({ name: 'find_user', text: '...', values: [1] })
--   asyncpg, JDBC, Prisma: prepared by default, nothing to enable

-- NEVER works in transaction pooling: SQL-level PREPARE is forwarded straight
-- through with no tracking, so it lands on one backend and EXECUTE may not.
PREPARE find_user (int) AS SELECT * FROM users WHERE id = $1;
EXECUTE find_user(1);   -- "prepared statement find_user does not exist"

-- The failure that appears during a RELEASE, not during development: a plan
-- cached on a shared backend outlives the DDL that invalidated it.
--   ALTER TABLE users ADD COLUMN locale text;
--   ERROR:  cached plan must not change result type
-- The documented fix is on the pooler's admin console, after the migration:
RECONNECT;
The version history matters, because the correct advice changed twice. Protocol-level support arrived in PgBouncer 1.21.0 and had to be switched on, since max_prepared_statements defaulted to zero. In 1.24.0 the default became 200 and the changelog describes it as enabling prepared statement support by default. So the question of whether prepared statements work behind your pooler is a version question first and a configuration question second, and on a managed pooler the version is not always yours to pick. The documentation also names the trap that surfaces during a release rather than in development: a plan cached on a shared backend outliving the DDL that invalidated it, which produces cached plan must not change result type, with RECONNECT on the admin console as the documented fix.
What to watch, and the message you will actually see
Two numbers tell you whether you are about to hit this: how many client backends exist right now, and what the ceiling really is. Read the second rather than assuming it, because a managed plan frequently sets max_connections below the documented default on a small instance, and the arithmetic you did on 100 was then wrong from the first line.
-- 1. How close to the wall are you right now? Read the ceiling rather than
--    assuming 100 — a managed plan often sets it lower on a small instance.
SELECT current_setting('max_connections')::int                  AS ceiling,
       count(*)                                                 AS in_use,
       count(*) FILTER (WHERE state = 'active')                 AS active,
       count(*) FILTER (WHERE state = 'idle in transaction')    AS idle_in_txn
FROM   pg_stat_activity
WHERE  backend_type = 'client backend';

-- 2. Who is holding them? This is why application_name is worth setting in
--    every service's connection string.
SELECT application_name, state, count(*)
FROM   pg_stat_activity
WHERE  backend_type = 'client backend'
GROUP  BY 1, 2
ORDER  BY 3 DESC;

-- 3. On the pooler, the same question in different words.
--    psql -p 6432 pgbouncer -c "SHOW POOLS"
--      cl_waiting  clients that sent a query and have no server yet
--      sv_idle     server connections free right now
--      maxwait     seconds the OLDEST waiting client has waited.
-- Climbing maxwait is the pooler's version of the FATAL.| What you see | What it means | Where to look |
|---|---|---|
| FATAL: sorry, too many clients already | Every slot beyond the superuser reserve is taken; the demand side of the sum crossed the supply side | pg_stat_activity, grouped by application_name |
| FATAL: remaining connection slots are reserved for roles with the SUPERUSER attribute | Free slots have fallen to superuser_reserved_connections — you are three connections from the wall, not at it | The same query, run as a superuser, which still gets in |
| New replicas never become ready while old ones serve fine | The pool is exhausted only for processes that started last, so the autoscaler keeps asking for more | The failing replica's own startup logs, not the platform dashboard |
| maxwait climbing in SHOW POOLS | Clients are being queued because default_pool_size is too small or the server is overloaded | The PgBouncer admin console, not Postgres |
| Client errors at almost exactly two minutes | query_wait_timeout disconnected a client that never got a server assigned; its default is 120 seconds | PgBouncer logs, alongside cl_waiting in SHOW POOLS |
The distinction the table is really drawing is between two different ceilings. Postgres refuses, so its symptom is an error at a hard limit. PgBouncer does not refuse, it queues, so its symptom is latency: maxwait is the number of seconds the oldest waiting client has been waiting, and the documentation names the two causes as an overloaded server or simply too small a pool_size. Watch both, because putting a pooler in front converts one failure mode into the other rather than removing it.
The rule worth carrying out of this is that a connection pool size is not a property of your application. It is a property of the platform's replica ceiling divided into the database's connection budget, and it belongs in a named constant next to the pool with the arithmetic written in the comment above it. Re-do that division every time you touch maxReplicas or change the database plan. It is the one number in the system that two teams adjust independently and neither of them owns.
Sources
- PostgreSQL Documentation — Connections and Authentication: max_connections, superuser_reserved_connections and reserved_connections
- PostgreSQL Documentation — Architectural Fundamentals: the server forks a new process for each connection
- PgBouncer — Features: the three pooling modes and the SQL feature map
- PgBouncer — Configuration: pool_mode, max_client_conn, default_pool_size, query_wait_timeout and max_prepared_statements
- PgBouncer — Changelog: protocol-level prepared statements added in 1.21.0, max_prepared_statements defaulted to 200 in 1.24.0