

Key Takeaway
Deploying a NestJS ERP API to a managed PaaS needs four things the framework does not do by default: a port and host taken from the platform, enableShutdownHooks so an in-flight posting finishes before the pod dies, a readiness endpoint kept separate from liveness, and database migrations run in one release job instead of every replica's bootstrap.
The deploy went green and the API was wrong. Three replicas of an ERP backend had rolled out, the schema had already moved forward, two of the pods were still serving the previous build against it, and a supplier invoice posted through the load balancer hit whichever pod answered first. Nothing crashed, no alert fired, and the numbers were simply not the numbers.
This is the checklist I now run before an ERP API goes anywhere near a managed platform: what NestJS needs in production, which health endpoint the platform actually calls, how to make migrations run exactly once across replicas, how to size a connection pool against the database's own ceiling, and which jobs should never live in a web service at all. Every framework and platform behaviour below is taken from the NestJS, Kubernetes, Prisma, TypeORM and PostgreSQL documentation, cited at the end.
An ERP API is not a web app that happens to have a database
The difference between an ERP backend and the average CRUD API is not traffic, it is that its writes are financial records. A duplicated page render is invisible. A duplicated goods receipt is a stock adjustment, a correcting journal, an audit note and a conversation with the finance team that opens with the word why. So every deployment decision gets judged against one question: can this rollout cause a write to happen twice, or land against a schema the running code does not expect?
That question quietly rules out several of the things that make a managed platform pleasant. Autoscaling is a correctness event and not only a cost one, because it multiplies whatever the process does while it boots. A rolling deploy means two builds read and write the same tables for the length of the roll. A restarting pod means an HTTP request that was halfway through a transaction. None of this is exotic; it is the ordinary behaviour of a replicated service. What is unusual is that the consequences are denominated in rupiah.
What NestJS needs before it leaves your laptop
The generated main.ts is a development file, and three lines of it change before deployment. Read the port from the platform's environment instead of hardcoding 3000, because the runtime injects PORT and then probes that port. Bind the host explicitly, so that nobody later copies a localhost example into a container and spends an afternoon wondering why a probe cannot reach a process that is plainly running. Then call enableShutdownHooks: the NestJS documentation is explicit that shutdown hooks are disabled by default and that you must enable the listeners yourself.
// main.ts — the production changes. The rest is the generated file.
import { NestFactory } from "@nestjs/core";
import { AppModule } from "./app.module";

async function bootstrap() {
  const app = await NestFactory.create(AppModule, { bufferLogs: true });

  // The platform decides the port. A hardcoded 3000 works on your laptop and
  // fails the moment the runtime injects PORT and probes that port instead.
  const port = Number(process.env.PORT ?? 3000);

  // Bind every interface. A process listening on 127.0.0.1 is unreachable
  // from the platform's health probe, which connects from outside the pod.
  const host = "0.0.0.0";

  // Off by default in NestJS: you must call this to get the signal listeners.
  // Without it, SIGTERM ends the process with in-flight requests still open,
  // including one that is halfway through writing a journal entry.
  app.enableShutdownHooks();

  await app.listen(port, host);
}
bootstrap();

// Once hooks are enabled, a termination signal runs onModuleDestroy, then
// beforeApplicationShutdown, then onApplicationShutdown — in that order.
@Injectable()
export class PostingService implements OnApplicationShutdown {
  async onApplicationShutdown(signal?: string) {
    this.logger.log("draining before exit, signal " + signal);
    // Whatever your own in-flight counter is. The point is that this code
    // gets to run at all, which is what enableShutdownHooks buys you.
    await this.inFlight.settled();
  }
}
With the hooks enabled, a termination signal runs onModuleDestroy, then beforeApplicationShutdown, then onApplicationShutdown, in that order. That sequence is the window where you stop accepting work and let the current transaction commit or roll back. Without it the process takes the default signal behaviour and exits, and every request still open dies with it — including the one that had written the journal header and not yet the lines. The same documentation notes that SIGTERM never works on Windows, which only matters when you develop there and cannot see why local behaviour differs from the platform's.
The health endpoint the platform actually calls
Liveness and readiness answer different questions, and the platform acts differently on each answer, so serving both from one endpoint is how a healthy pod gets restarted. Kubernetes documents the split precisely: a liveness probe determines when to restart a container, while a readiness probe that returns a failed state causes the EndpointSlice controller to remove the pod's IP address from the Services matching it. A liveness check that runs a query therefore turns a slow database into a restart loop, which is the cascading failure the same page warns about — containers restarting under load, failed client requests, and more work pushed onto the pods still alive.
| Probe | What a failure does | What it may touch |
|---|---|---|
| Startup | Kills the container, which is then subject to its restart policy | Nothing. It only has to prove the process finished starting |
| Liveness | Restarts the container once failures exceed the configured tolerance | Process-local state only — no database, no queue, no outbound HTTP |
| Readiness | Removes the pod's IP from the EndpointSlices of matching Services | The dependencies a real request needs, each behind its own timeout |
// health.controller.ts — two endpoints, because the platform asks two
// different questions and acts differently on each answer.
import {
  Controller,
  Get,
  ServiceUnavailableException,
} from "@nestjs/common";

@Controller()
export class HealthController {
  constructor(private readonly db: DataSource) {}

  // Liveness: "is this process wedged?" Touch nothing external. A liveness
  // check that queries Postgres turns one slow query into a pod restart —
  // and restarts under load are how a busy ERP takes itself down.
  @Get("/healthz")
  live() {
    return { status: "ok", uptime: process.uptime() };
  }

  // Readiness: "should traffic come here?" This one may touch the database,
  // because a failure means "take me out of the load balancer", not "kill me".
  @Get("/readyz")
  async ready() {
    try {
      // Bound it. An unbounded probe query hangs until the probe's own
      // timeout expires and then fails anyway; failing fast is more useful.
      await Promise.race([
        this.db.query("SELECT 1"),
        new Promise((_, reject) =>
          setTimeout(() => reject(new Error("db timeout")), 2000),
        ),
      ]);
    } catch {
      // An httpGet probe counts 200 to 399 as success, so a handler that
      // returns 200 with a body saying "database unreachable" is a PASSING
      // probe. Throw, so the status code carries the answer.
      throw new ServiceUnavailableException("database unreachable");
    }
    return { status: "ok" };
  }
}
One more trap sits in the mechanism rather than the design: an httpGet probe is considered successful for any status from 200 up to 399. A handler that catches its own database error and returns 200 with a body reading status error is a passing probe, and the pod keeps taking traffic it cannot serve. Throw a ServiceUnavailableException so the status code carries the verdict, or let a library such as @nestjs/terminus assemble the indicators and the status code for you.
Migrations run once, or they run once per replica
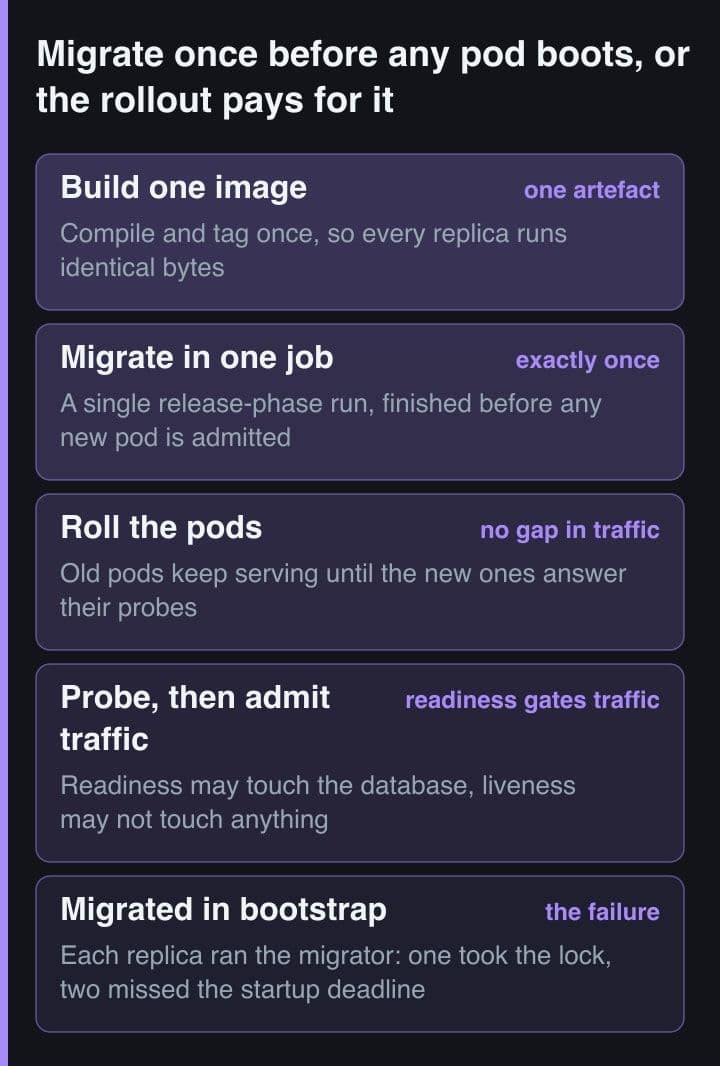
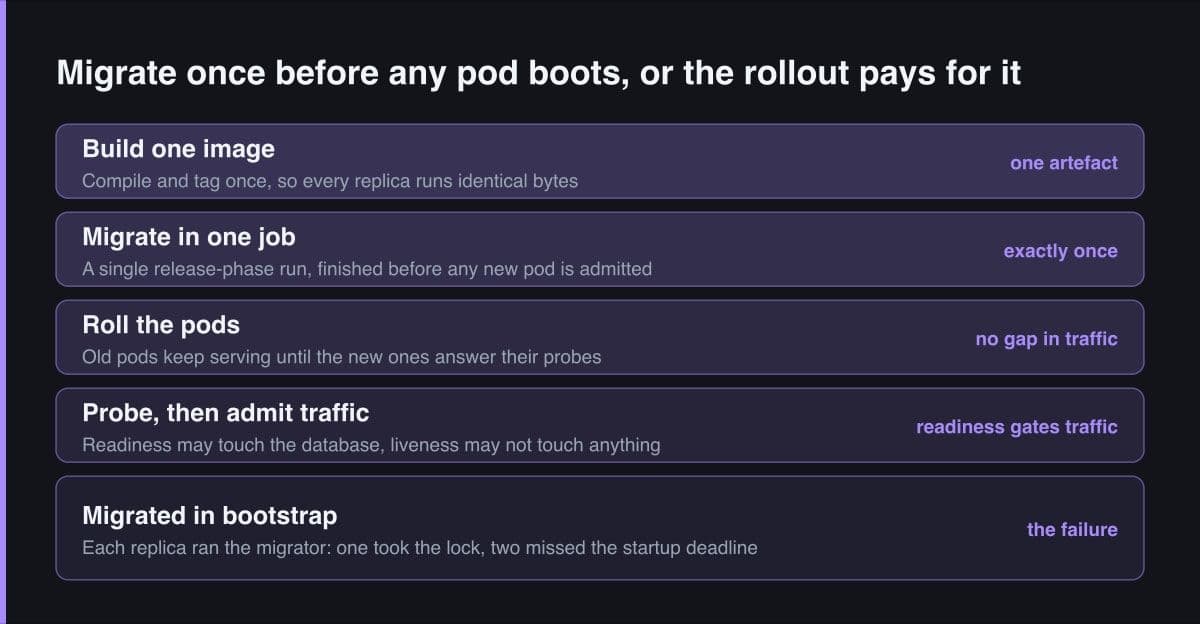
The only safe place for a migration is a step that finishes before any new pod is admitted. TypeORM offers migrationsRun on the DataSource, documented as indicating whether migrations should be auto-run on every application launch; on three replicas that is three launches. Prisma is better than the folklore here — its documentation states that concurrent deploys are safe, because on PostgreSQL the whole apply runs inside a transaction guarded by an advisory lock, so two runs serialise instead of interleaving.
// Wrong: migrate while the application boots.
// package.json
//   "start:prod": "prisma db migrate && node dist/main.js"
//
// or the TypeORM option that does the same thing without you noticing:
export const dataSource = new DataSource({
  type: "postgres",
  url: process.env.DATABASE_URL,
  migrationsRun: true, // documented as: auto-run on every application launch
});
// Three replicas is three launches. On PostgreSQL, Prisma guards the apply
// with an advisory lock, so the DDL still lands once — but the two replicas
// that lose the race sit in the lock queue while they are starting, spend
// their startup-probe budget waiting, and get failed by the platform with
// the schema already moved. A migrated database and a failed release.

// Right: one release step, finished before any new pod is admitted.
// package.json
//   "db:check":   "prisma migration check",
//   "db:show":    "prisma db migrate --show --db $DATABASE_URL",
//   "db:deploy":  "prisma db migrate --db $DATABASE_URL",
//   "start:prod": "node dist/main.js"
//
// Wire db:deploy as the platform's release / pre-deploy command, or as a
// one-shot job whose exit code gates the rollout. Nothing rolls if it fails.
//
// TypeORM equivalent, with migrationsRun left false in the DataSource:
//   "db:deploy": "typeorm migration:run -d dist/data-source.js"
The lock protects the schema. It does not protect the rollout, and that distinction is the failure I shipped. Every replica ran the migrator as it started, one took the lock and applied the change, and the other two sat in the queue spending the startup budget the platform allows a new pod. They were failed for never becoming ready, the release was rolled back, and the schema had already moved — so the rollback put the old build in front of the new tables. Splitting it into ordered steps costs one line of platform configuration. Prisma's own deploy sequence is three commands, and the middle one is worth keeping: migration check runs offline, db migrate with the show flag logs exactly what would run, and only the third command touches the database.
A migration that runs exactly once can still break a deploy. During a rolling release the previous build is still serving against the new schema, so a renamed or dropped column takes production down for as long as the roll takes. Every migration deployed this way has to be readable by the code already running: add and backfill first, drop only once the old build is gone.
Pool size times replica count is the number that matters
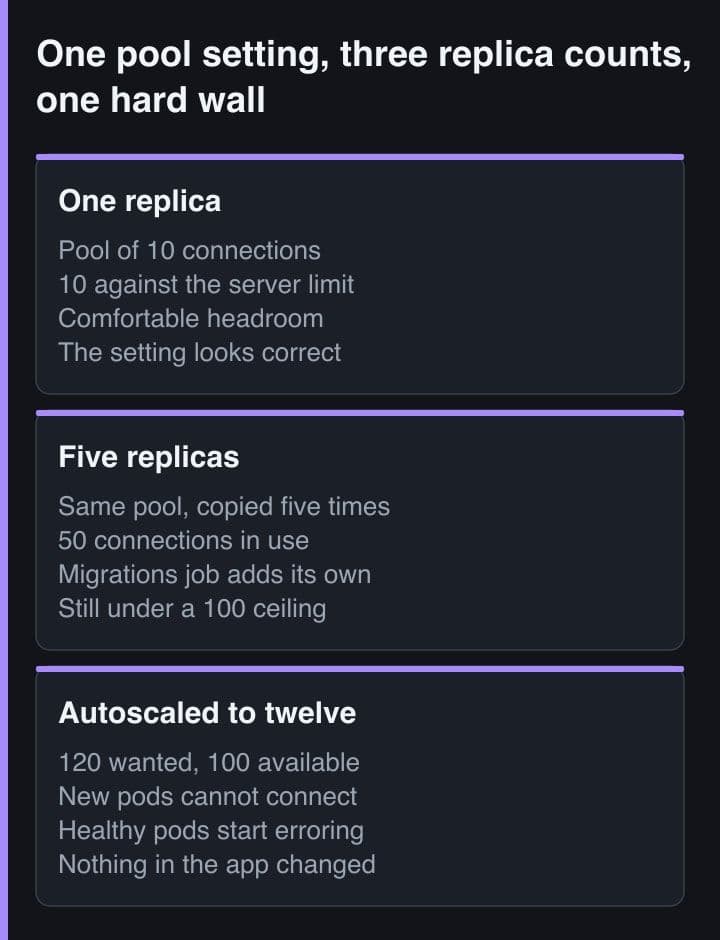
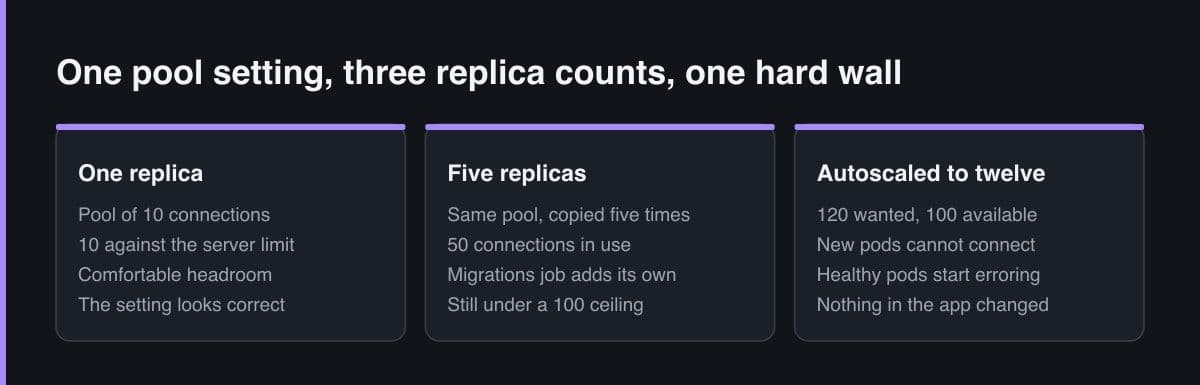
Pool size is not a per-service setting, it is a per-cluster budget. The number to compare against the database's ceiling is pool size multiplied by replica count, plus everything else that opens a connection. PostgreSQL documents max_connections as typically 100 by default and superuser_reserved_connections as three, so about 97 slots are available to ordinary roles before the migration job, the metrics exporter, the background worker and your own psql session have taken theirs.
// The only pool number that matters is pool size x replicas + everything
// else that opens a connection.
//
//   max_connections                       100   documented default
//   minus superuser_reserved_connections    3   documented default
//   = usable                               97
//
//   web pool 20 x 5 replicas              100   -> connections refused
//
//   web pool 10 x 5 replicas               50
//   + worker pool 5 x 2 replicas           10
//   + the migration job                     1
//   + a metrics exporter                    2
//   + your own psql session                 1
//   = 64, which still leaves room for the OLD replica set during the
//     minute of a rolling deploy when both generations are alive.

export const dataSource = new DataSource({
  type: "postgres",
  url: process.env.DATABASE_URL,
  migrationsRun: false,
  // Derive it. MAX_REPLICAS is the autoscaler's ceiling, not today's count —
  // the pool has to be safe at a replica count you never watch happen.
  poolSize: Math.max(
    2,
    Math.floor(
      (Number(process.env.DB_USABLE_CONNECTIONS ?? 97) * 0.6) /
        Number(process.env.MAX_REPLICAS ?? 5),
    ),
  ),
});
The failure then lands at the worst possible moment. A rolling deploy means the old replica set and the new one are both connected, so peak connection use happens during the release rather than during the busy hour, and the symptom is a pod that cannot start rather than a slow page. An autoscaler makes it worse by turning the replica count into a number you never chose, so size the pool against the autoscaler's ceiling instead of today's count. If the arithmetic says you need more concurrency than the ceiling allows, that is a transaction pooler question, not a bigger pool.
Environment separation is a data-safety control
Environment variables are usually filed under convenience. On an ERP they are a data-safety control, because the worst outcome is not a leaked key but a staging pod holding a production database URL: staging traffic is test traffic, and test traffic in an ERP posts journals. Three classes of variable have to differ per environment, and none of them should be allowed to fall back to a default.
- The database URL and its credentials — separate instances, not one instance holding two schemas with a naming convention as the only thing between them.
- Every outbound integration endpoint: tax and e-invoicing, payment channels, WhatsApp notifications. A test posting must not be able to send a real document to a real counterparty.
- The switches that create or destroy data: seeding, TypeORM's synchronize option, which its own documentation warns not to use in production because you can lose production data, and any feature flag that writes.
Then validate the whole set at boot and refuse to start when something is missing, because a service that starts with a missing variable discovers the problem at the first request instead of at deploy time. Log the environment name in the startup line as well. It takes a second to read and it has stopped me running a migration against the wrong database more than once.
What does not belong in the web service at all
The last decision is what to keep out. Month-end close, batch depreciation postings, a stock revaluation across a year of movements, a report that walks the whole general ledger: anything whose runtime can exceed the platform's request timeout, or outlive a pod rotation, does not belong behind an HTTP handler. Neither does a scheduler registered inside the application, because it runs on every replica — a nightly posting job on three pods is three postings unless something outside the schedule makes it idempotent.
The shape that works on a PaaS is three deployments from one image: a web service that serves only short requests, a worker consuming a queue with a concurrency of one for the jobs that must be serial, and a scheduler that enqueues rather than executes. The platform then treats the long job as its own process with its own lifetime, and a restart in the middle of it becomes a job to retry rather than a half-finished posting.
Build one image and change only the start command between web, worker and scheduler. The three deployments are then provably running the same code, and the migration the worker needs cannot arrive a deploy later than the migration the API needs.
The rule I carry out of this is short. Deploy the schema and the code as two ordered steps, never as one. Give the platform two endpoints, because it is asking two different questions and it will act on both. And count connections before the autoscaler counts them for you. A managed PaaS removes the servers, not the ordering, and on an ERP API the ordering is the part that eventually shows up in the ledger.
Sources
- NestJS documentation — Lifecycle events and application shutdown hooks
- Kubernetes documentation — Liveness, readiness and startup probes
- Prisma documentation — Applying a migration, including concurrent deploys
- TypeORM documentation — DataSource options, migrationsRun and poolSize
- PostgreSQL documentation — Connection settings and reserved connection slots