

Key Takeaway
Kubernetes HPA autoscaling on a managed PaaS does not serve the start of a traffic spike. The controller loop runs every fifteen seconds by default, a scale-up still waits for pod scheduling and a readiness probe, and CPU utilisation is measured against resources.requests, so the pods already running absorb the opening burst.
Helipod's autoscaling panel is three fields: a minimum replica count, a maximum, and a CPU target. The screenshot on its own front page shows min 1, max 10 and a target of 70 per cent, and the promise beside it is accurate as far as it goes — you set the limit, and HPA handles the rest. What those three fields hide is that everything happening between the moment traffic arrives and the moment a new pod serves its first request is decided by Kubernetes defaults nobody in that panel ever chose.
So I read the Kubernetes Horizontal Pod Autoscaler documentation with a stopwatch in mind, and wrote down every default that fires during a spike: the sync period, the scale-up policies, the tolerance, the two readiness delays. This post is that timeline, and then the four application-level facts no platform can fix for you, however good its dashboard is.
Autoscaling on is not the same as the spike served
No autoscaler adds capacity before the load that justifies it exists. The Horizontal Pod Autoscaler is a control loop: it reads a metric, compares it to a target, and asks a Deployment for a different replica count. Every one of those steps happens after your traffic has already arrived and already been served — or already been queued — by the pods you had. There is no predictive path in the CPU-based configuration a PaaS exposes.
The Kubernetes documentation says this plainly: horizontal pod autoscaling is implemented as a control loop that runs intermittently, and it is not a continuous process. Treating it as insurance against a traffic spike is a category error. It is insurance against a spike that lasts longer than a couple of minutes. The opening burst is a capacity-planning problem, and the only setting that touches it is the minimum replica count you chose before anything happened.
Three fields in the dashboard, a dozen defaults underneath
Those three fields map onto a HorizontalPodAutoscaler object, and that object has a behavior section the dashboard never shows you. Kubernetes documents its defaults explicitly, which means you can write out exactly what you agreed to when you flipped the switch.
# What "min 1, max 10, CPU target 70%" expands into.
apiVersion: autoscaling/v2
kind: HorizontalPodAutoscaler
metadata:
  name: web
spec:
  scaleTargetRef:
    apiVersion: apps/v1
    kind: Deployment
    name: web
  minReplicas: 1          # the ONLY field that helps before a spike starts
  maxReplicas: 10
  metrics:
    - type: Resource
      resource:
        name: cpu
        target:
          type: Utilization
          averageUtilization: 70   # 70% of resources.requests.cpu, not of the node

  # Nothing below is in the dashboard. These are the defaults you inherit.
  behavior:
    scaleUp:
      stabilizationWindowSeconds: 0    # no smoothing: act on the first reading
      policies:
        - type: Percent
          value: 100                   # at most double, per 15s tick
          periodSeconds: 15
        - type: Pods
          value: 4                     # or add 4 pods, per 15s tick
          periodSeconds: 15
      selectPolicy: Max                # whichever of the two allows more
    scaleDown:
      stabilizationWindowSeconds: 300  # 5 minutes of rolling maximum
      policies:
        - type: Percent
          value: 100
          periodSeconds: 15
The asymmetry is the part worth memorising. Scaling up has a stabilization window of zero seconds, so the controller acts on the first reading that crosses the target. Scaling down has a window of 300 seconds and takes the highest recommendation from anywhere inside it — a rolling maximum, designed to stop the controller removing a pod it will need again a moment later. The platform is biased towards keeping capacity, which is the right bias, and it also means an over-scaled app stays over-scaled for five minutes after the spike ends. On per-resource daily billing that is a line item, not a rounding error.
The formula, run against a spike
The controller's entire decision is one ratio: desiredReplicas is currentReplicas multiplied by the current metric value over the desired metric value, rounded up. It skips the change altogether when the ratio is close enough to 1.0, inside a tolerance that defaults to 0.1. With a 70 per cent CPU target, that means anything between roughly 63 and 77 per cent average utilisation is treated as steady state and ignored.
desiredReplicas = ceil( currentReplicas * currentMetricValue / desiredMetricValue )

# One pod. resources.requests.cpu = 500m. Target utilisation = 70%.
# The HPA is therefore aiming at 350m of measured usage per pod.

# Quiet, 160m per pod:
#   160 / 350 = 0.46  ->  ceil(1 * 0.46) = 1

# Saturated. If the platform sets limits equal to requests, which is the usual
# choice when a plan sells a fixed vCPU count, usage cannot pass 500m, so
# measured utilisation cannot pass 100% and the ratio cannot pass 1.43:
#
#   500 / 350 = 1.43  ->  ceil(1 * 1.43) =  2
#                         ceil(2 * 1.43) =  3
#                         ceil(3 * 1.43) =  5
#                         ceil(5 * 1.43) =  8
#                         ceil(8 * 1.43) = 12  ->  clamped to maxReplicas: 10
#
# Five decisions to reach the ceiling. One decision per sync period is
# 75 seconds of arithmetic, and that is the optimistic case: a not-yet-Ready
# pod is assumed to be consuming 0% of the target, which dampens the next
# scale-up rather than accelerating it.
Two things in that arithmetic surprised me. First, the metric rather than the policy is usually what limits the ramp: the default scale-up policies would allow adding four pods or doubling every fifteen seconds, but a pod whose CPU limit equals its CPU request can never report more than 100 per cent utilisation, so the ratio is capped and the controller asks for less than it is permitted to give. Second, the dampening. When some pods are not yet Ready, the controller recalculates on the assumption that they consume nothing, specifically to avoid overshooting — so the moment you most want it to be aggressive is the moment it is deliberately conservative.
The clock runs in fifteen-second ticks
The loop's interval is set by the sync-period flag on kube-controller-manager, and it defaults to fifteen seconds. On a managed platform that is a cluster-wide setting, which means it is not yours. A spike that begins one second after a tick waits almost a full period simply to be noticed, and nothing about your app or your configuration changes that.
After the decision, the replica count on the Deployment changes immediately and the useful work has not started. The scheduler still has to find a node with room for the pod's CPU request, the container image still has to be present or pulled, the process still has to boot, and the readiness probe still has to pass before the Service will route a single request to it. None of those four steps has a documented time budget, because all four depend on your image, your node pool and your application. They are also the only part of the timeline you can actually shorten.
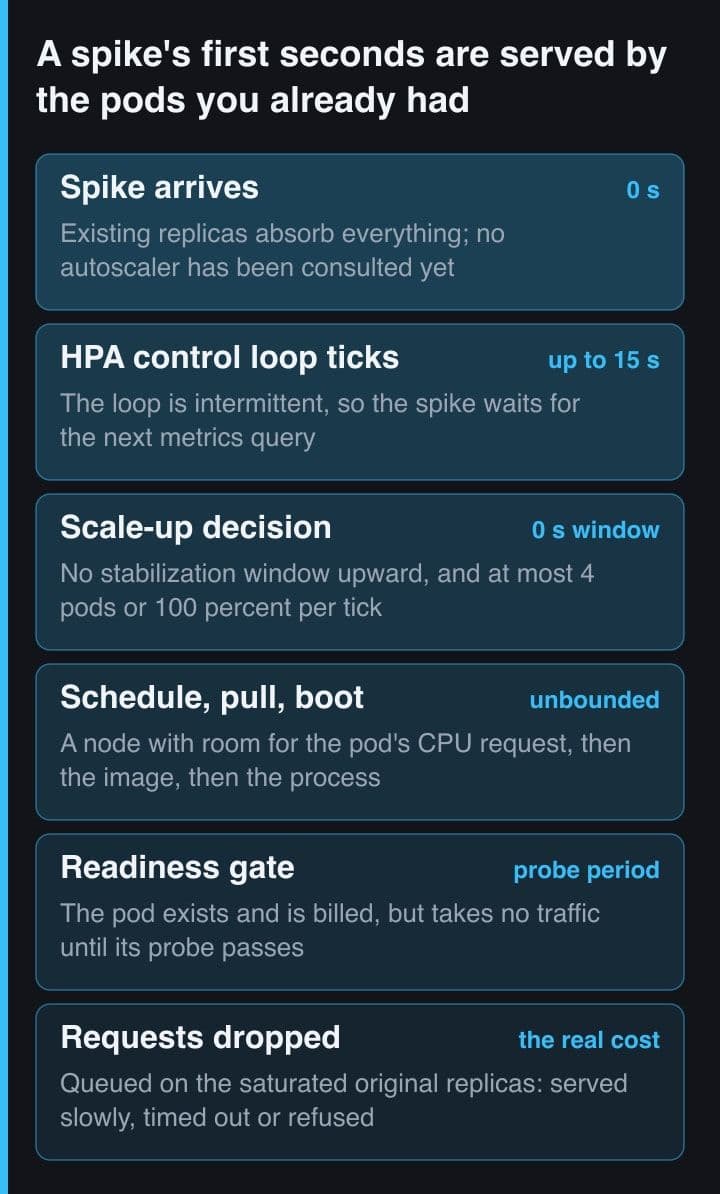
The one setting that changes what happens in the first fifteen seconds is minReplicas. Set it from the opening burst you expect rather than from your average load, accept that you are paying for idle pods between spikes, and treat that as the price of the window no autoscaler can cover. Every other knob only affects what happens after the damage.
resources.requests is the denominator of every decision
A CPU target is not a percentage of the node or of your plan. The controller calculates utilisation as a percentage of the equivalent resource request on the containers in the pod, so resources.requests.cpu is the denominator of every scaling decision the platform will ever make about your app. Kubernetes defines one CPU unit as one physical core and 100m as one hundred millicpu, so these are absolute quantities: a wrong one does not shift the target slightly, it changes what the target means.
# Wrong: no CPU request. The HPA has no denominator.
resources:
  limits:
    cpu: "1"
    memory: "1Gi"
# The docs are blunt: if a container has no relevant resource request set, CPU
# utilisation for the Pod is undefined and the autoscaler takes no action for
# that metric. The dashboard still says autoscaling is enabled.

# Also wrong: a request the app can never saturate.
resources:
  requests:
    cpu: "2"        # a single Node process runs your JS on one thread
  limits:
    cpu: "2"
# Target 70% now means 1400m per pod. One busy Node process gets nowhere near
# that, so the HPA reads a low utilisation and never scales. Nothing errors.

# Right: request what one pod's share of the work actually costs.
resources:
  requests:
    cpu: "500m"     # measured under load, not guessed
    memory: "512Mi"
  limits:
    cpu: "1"        # headroom above the request, so utilisation CAN exceed 100%
    memory: "512Mi"
The failure I would not have predicted is the silent one. A request far larger than the app can consume makes the target unreachable, so the HPA reports comfortable utilisation while requests are timing out, and every dashboard stays green. A missing request is worse: the documentation states that if a container has no relevant resource request set, CPU utilisation for the pod is undefined and the autoscaler takes no action for that metric at all. Autoscaling is on, configured, displayed, and doing nothing.
Setting requests equal to limits is the safe default for scheduling and the quiet enemy of fast scaling. CPU limits are enforced by throttling, so a pod pinned at its limit can never report more than 100 per cent utilisation, and against a 70 per cent target the ratio cannot pass about 1.43 — roughly one extra pod per existing pod, per tick. Leave headroom between request and limit if you want the controller to be able to ask for a big jump.
A new pod is not a warm pod
Readiness, not existence, is what puts a pod into service. If a readiness probe returns a failed state, the EndpointSlice controller removes the pod's IP address from the EndpointSlices of every Service that matches it, and the probe keeps running for the container's whole lifecycle rather than only at startup. The probe is therefore the admission gate for all your new capacity, and how honest it is decides whether the spike is served or merely counted.
# A readiness probe is not a health check. It is the switch that puts this
# pod's IP into the Service's EndpointSlices. Until it passes, the pod exists,
# is billed, and serves nothing.
readinessProbe:
  httpGet:
    path: /api/ready      # must touch what a request needs: DB pool, cache client
    port: 3000
  periodSeconds: 5        # a pod servable now still waits up to 5s to be asked
  failureThreshold: 2
  # No initialDelaySeconds. It is a fixed tax on every scale-up you will
  # ever do; use a startupProbe if warm-up is genuinely slow.

startupProbe:
  httpGet:
    path: /api/ready
    port: 3000
  periodSeconds: 3
  failureThreshold: 20    # up to 60s to warm up, then readiness takes over

livenessProbe:
  httpGet:
    path: /api/live       # process-only: never checks the database
    port: 3000
  periodSeconds: 15
The HPA has its own opinion about brand new pods, and it is a conservative one. A pod that is unready shortly after starting is treated as still initialising for an initial-readiness-delay that defaults to thirty seconds, and its CPU is ignored for a cpu-initialization-period that defaults to five minutes unless the sample was taken entirely while it was Ready. On top of that, a fresh Next.js pod is cold in a way Kubernetes cannot see: the Next.js self-hosting guide notes that generated cache assets are stored in memory and on disk, and that under a container orchestration platform like Kubernetes each pod holds its own copy of the cache. Scaling from one pod to ten multiplies your origin work by ten until those caches fill.
A CPU target is blind to a connection pool
The bottleneck a CPU-based autoscaler cannot see is the one where your app is waiting rather than working. A pod blocked on a database connection burns almost no CPU, so utilisation falls exactly when the user experience gets worse, and the honest reading of that metric is that the app needs fewer pods. Meanwhile the pool configuration you wrote when the app was a single pod is now multiplied by the replica count.
// One pod's pool, written when the app ran as one pod.
const pool = new Pool({
  connectionString: process.env.DATABASE_URL,
  max: 10,                 // 10 sockets per pod
  idleTimeoutMillis: 30000,
});

// The HPA scales 1 -> 10 pods on CPU. This file did not change.
//   10 pods * 10 sockets = 100 connections demanded of one Postgres server,
// whose own ceiling is set by max_connections, at server start, by someone
// who was never told your maxReplicas.
//
// Worse: pods 8, 9 and 10 fail their first query, so they never pass the
// readiness probe, so they are set aside as not-yet-Ready, so the HPA
// assumes they consume nothing and asks for more pods.

// The fix is division, done before the spike:
const pool = new Pool({
  max: Math.max(2, Math.floor(POOL_BUDGET / MAX_REPLICAS)),
});| What you see during the spike | What the CPU target sees | What actually helps |
|---|---|---|
| Requests queue while CPU sits near the target | A ratio inside the 0.1 tolerance, so no action at all | The limit is concurrency, not CPU — scale on queue depth or in-flight requests instead |
| Latency climbs while CPU falls | A candidate for scaling down | Look at I/O: a pod waiting on a database burns no CPU while it waits |
| Every new pod errors on its first query | Unready pods, assumed to consume nothing, so the scale-up is dampened | Divide the connection pool by maxReplicas before the spike, not after it |
| The first requests to each new pod are slow | Nothing — a cache miss is not a metric it collects | A shared cache handler, or an explicit decision to accept a cold tail on every scale-up |
| Replicas stay at the ceiling long after traffic drops | The highest recommendation from the last 300 seconds | Nothing, and that is correct — shorten the stabilization window only if you can prove the spike is over |
Every row has the same shape: the metric is behaving correctly and answering a different question from the one you are asking. That is not an argument against CPU-based autoscaling, which is cheap, needs no extra components and handles the common case well. It is an argument for knowing which of your failures it can see.
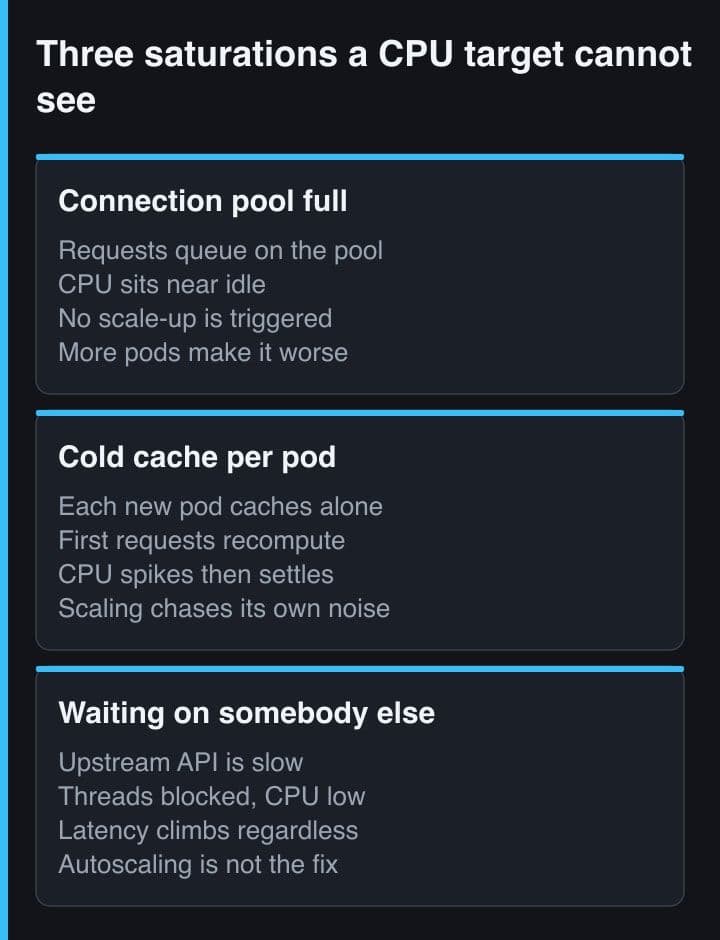
What I check before a launch now
None of this needed a different platform. It needed five decisions taken before the traffic arrived rather than during it.
- Measure the app's real CPU under load and set resources.requests.cpu to that figure, because it is the denominator of every scaling decision that follows.
- Set minReplicas from the opening burst rather than the average, since nothing else affects the first fifteen seconds.
- Point the readiness probe at an endpoint that fails until the app can genuinely serve a request, and add a startup probe instead of an initialDelaySeconds if warm-up is expensive.
- Divide the database connection pool by maxReplicas, so the ceiling of the autoscaler is also the ceiling of the connection count.
- Watch the logs of every pod at once during the first real spike, so the timeline is observed rather than assumed.
Helipod's real-time log streaming shows every pod at once in the browser, and its browser terminal opens a shell into a running production pod without SSH keys or a VPN. That pairing is what turns this timeline from theory into something observable: you see the new pod's first log line, its first failed readiness check and its first slow query, in the order they actually happened.
Autoscaling stopped being a switch for me and became four numbers I have to be able to defend: the request, the target, the minimum and the maximum. A managed PaaS runs the loop reliably, and that is genuinely most of the work. Deciding what the loop measures, and having enough capacity already running to survive the fifteen seconds before it notices anything, is still mine.
Sources
- Kubernetes documentation — Horizontal Pod Autoscaling: the control loop, the sync period, the scaling formula, the tolerance and the behavior defaults
- Kubernetes documentation — Resource Management for Pods and Containers: CPU units, requests, and limits enforced by throttling
- Kubernetes documentation — Pod Lifecycle: container probes, and how readiness controls a Service's endpoints
- Next.js documentation — Self-Hosting: caching and ISR, and why each pod holds its own copy of the cache
- Helipod — the Indonesian PaaS whose autoscaling panel exposes a minimum, a maximum and a CPU target