

Key Takeaway
An AI DevOps assistant shortens Kubernetes triage by correlating a restart with the deploy before it and by naming the stack trace that repeats, but it cannot see a full node disk, an upstream DNS failure or an expired secret. Treat its answer as a hypothesis, confirm the exit code yourself, then act.
Helipod's own page for Heli Crew lists the questions it expects you to ask: why is my service returning 502, show recent error logs, redeploy now. Those are close to the first three things anyone does when a pod starts restarting, and a chat box that answers all of them from a phone is genuinely useful. Two of them are questions, though, and the third is an action — and the distance between those two categories is where triage with an assistant goes wrong.
This is an assessment of the category rather than a review of one product. I have not run a production estate on Helipod, so what I say the tool can do comes from its own feature list; the Kubernetes behaviour comes from the upstream documentation, and the habits come from operating my own clusters. What follows is what a log-reading assistant genuinely shortens, the class of fault it cannot see by construction, and where I would put it in a sequence.
What it shortens is correlation, not diagnosis
The most valuable thing these assistants do is put events back in time order. A pod that started restarting four minutes after a rollout is almost always the rollout, and establishing that by hand means reading the deployment's rollout history, checking which image tag the running pod actually carries, and lining both up against the restart count and the last termination time. An assistant with read access to the platform does that join in one sentence, while you are still finding the right namespace.
Correlation is the cheap half of triage and the half humans are worst at under pressure, because the pressure is exactly what stops you noticing that a deploy at 13:41 and a first restart at 13:44 are the same event. The catch is that the assistant states a coincidence in the same tone as a cause. Two pods that began failing after a rollout may have failed because a node filled up during it, and the sentence reads identically either way.
The three lines that actually settle a restart
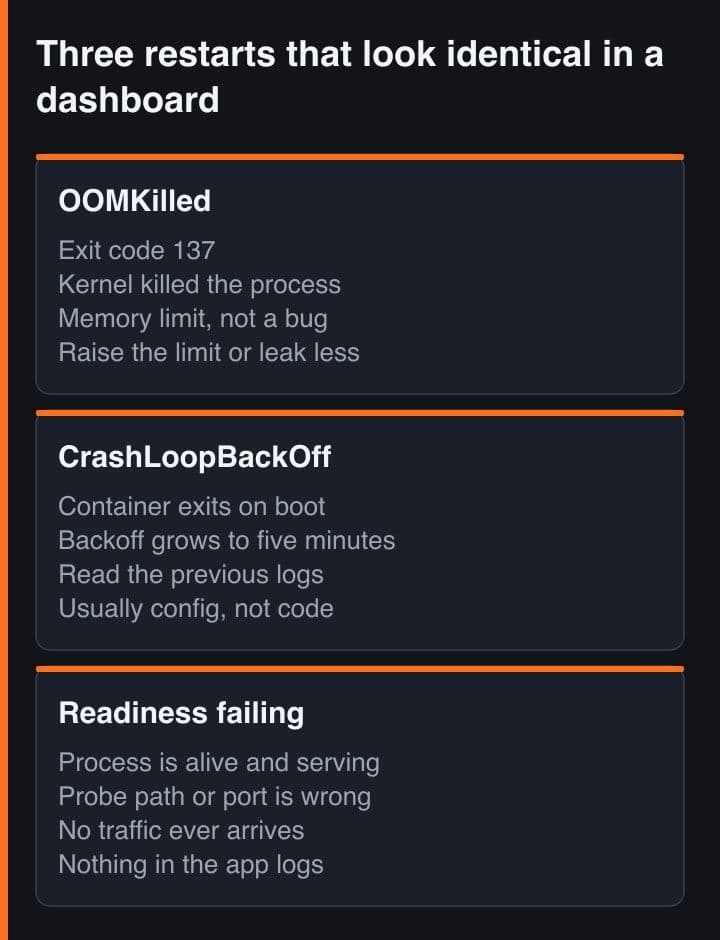
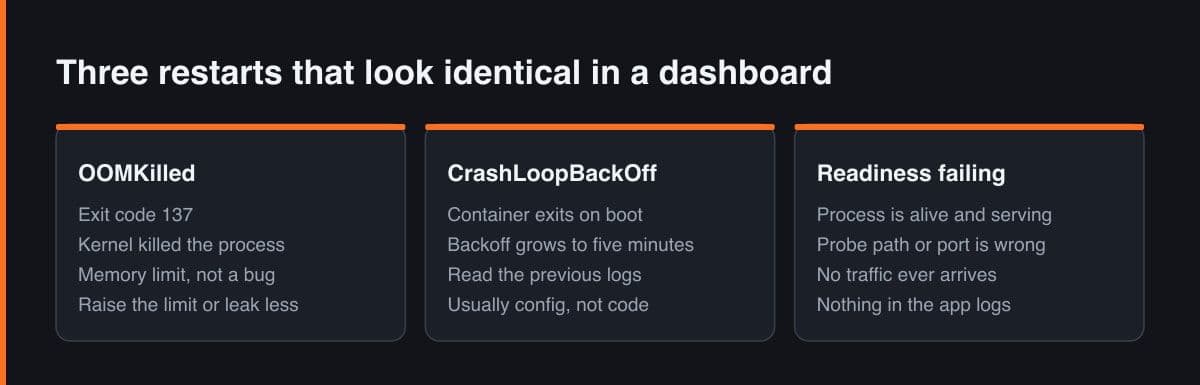
A chat summary will happily tell you the application crashed. The pod itself says something far more specific, and there are only a handful of sentences it can say. This is the most useful output in Kubernetes for the first two minutes of an incident, and it is exactly what a reader who leans on the assistant never learns to read.
$ kubectl describe pod checkout-7d9c8b6f5-2xk9m
...
    State:          Waiting
      Reason:       CrashLoopBackOff
    Last State:     Terminated
      Reason:       OOMKilled
      Exit Code:    137
      Started:      Fri, 04 Sep 2026 13:41:58 +0700
      Finished:     Fri, 04 Sep 2026 13:44:12 +0700
    Restart Count:  6
    Limits:
      memory:       512Mi

Events:
  Type     Reason     Age                From     Message
  ----     ------     ----               ----     -------
  Normal   Pulled     14m                kubelet  Container image "registry.internal/checkout:2026.09.04-1" already present on machine
  Warning  Unhealthy  9m (x4 over 12m)   kubelet  Readiness probe failed: HTTP probe failed with statuscode: 503
  Warning  BackOff    2m (x18 over 11m)  kubelet  Back-off restarting failed container

# Three things are true here and only one is the fault. CrashLoopBackOff is the
# waiting state, the readiness failure is what a dying container looks like from
# outside, and "OOMKilled / 137" is the sentence that decides what you fix.| What the summary says | The line that settles it | What it actually is |
|---|---|---|
| The app ran out of memory | Reason OOMKilled, Exit Code 137 | The container reached its own memory limit and was killed. Raising the limit is a fix; a leak is still a leak. |
| The app is crash looping | State Waiting, Reason CrashLoopBackOff, rising Restart Count | A backoff state, not a cause. Kubernetes is spacing out restart attempts; the reason is in the previous container's log. |
| The container was stopped | Exit Code 143 and no OOM reason | Something asked it to stop with SIGTERM — a rollout, an eviction, a node drain. Frequently not your code's fault at all. |
| The service is down | Readiness probe failed, Restart Count unchanged | The container is alive but out of the Service endpoints, so no traffic reaches it. Restarting it changes nothing. |
| The deploy failed | ImagePullBackOff or FailedScheduling, zero restarts | It never ran, so there is no application log to summarise — which is where a log-first assistant is weakest. |
Exit code 137 is the one worth memorising. Kubernetes' own memory-limits page shows a container terminated with reason OOMKilled and exitCode 137, which is 128 plus signal 9, SIGKILL. By the same convention a container stopped with SIGTERM, signal 15, reports 143 — and SIGTERM is the default stop signal for both containerd and CRI-O, so 143 usually means a rollout, an eviction or a drain rather than a bug in your code. One caveat the docs are explicit about: the runtime honours a STOPSIGNAL declared in the image, so a container built with a different stop signal reports a different number.
The trace that repeats, and the one that happened once
Here the assistant earns its place. Twelve thousand log lines from a container that restarted six times contain perhaps four distinct events, and finding them by eye is the part of triage that is pure tedium. Ranking lines by shape rather than by scroll position is exactly what a language model is good at — and it is also something you can do yourself in one pipeline, which is worth knowing before you depend on the chat window.
# The chat answer was "repeated database connection errors". Twelve thousand
# lines of logs; the open question is whether that is one fault or three.

# --previous reads the container from BEFORE the last restart. The live one
# started 40 seconds ago and knows nothing about why its predecessor died.
kubectl logs checkout-7d9c8b6f5-2xk9m --previous --timestamps > prev.log

# Collapse the noise into shapes: drop the timestamp, fold ids and numbers,
# then count identical lines. This is the whole trick.
sed -E 's/^[^ ]+ //; s/[0-9a-f-]{30,}/ID/g; s/[0-9]+/N/g' prev.log \
  | sort | uniq -c | sort -rn | head

#   8231 ERROR pool: acquire timed out after Nms
#     14 WARN  retrying migration, lock held by session N
#      1 FATAL config: failed to decrypt secret, cipher key version N not found

# The 8231 is the symptom the summary led with. The line that occurred ONCE,
# first, and never again is the outage. Ranking by frequency buries it.
The trap is in the ranking. A summary of logs is not the logs, and both a model and a uniq pipeline sort by how often a line appears, while the line that explains an outage often appears exactly once, near the beginning, before the retry storm buried it. So I ask for the first error and the rarest error as well as the most common one. The most common one is usually a consequence.
The real win is the operator who has never run kubectl describe
The honest case for this category is not that it makes an experienced operator faster. It is that it gives a developer with no Kubernetes background a way into a system that otherwise refuses to explain itself. Helipod lists checking CPU and memory, showing recent error logs and creating a Redis instance as things you ask for in chat; for someone whose first encounter with a cluster would otherwise be a wall of describe output, that is a real reduction in the cost of looking.
The same feature has an obvious failure mode: a person who only ever asks the chat window never learns what OOMKilled means, and the assistant is at its least reliable precisely when the answer is not in the logs. I would still rather a junior engineer read a summary and then the events than never open the events at all, so the way I frame it is a translation layer over output the reader is expected to go and look at.
Ask for candidates, not causes. A prompt like give me three possible causes ranked, and quote the log line or event each one rests on, produces something you can check in a minute. A prompt like why is this pod restarting produces one confident sentence with nothing attached to it.
It cannot see what was never in the logs
This is the structural limit, and a better model does not fix it. An assistant that reads your container's stdout and your platform's events can only reason about what was written there. Three of the most common production faults leave a perfectly clean application log: a node that filled its disk and started evicting pods, an upstream name that stopped resolving, and a credential that expired on a date nobody had in a calendar. Each produces an application-level error that describes the symptom accurately and points at the wrong component.
# 1. The node, not the pod. Check this first when several unrelated
#    workloads degrade in the same minute.
kubectl get nodes -o wide
kubectl describe node worker-3 | sed -n '/Conditions:/,/Addresses:/p'
#   DiskPressure   True   KubeletHasDiskPressure   image garbage collection failed

# 2. Cluster events, oldest first. Evictions, FailedMount and FailedScheduling
#    never appear in your container's stdout, so they never reach the summary.
kubectl get events -A --sort-by=.lastTimestamp | tail -20

# 3. Resolution and reachability from inside the cluster. An upstream DNS
#    failure and "the payments API is down" produce the same client-side error.
kubectl run netcheck --rm -it --restart=Never --image=busybox:1.36 -- \
  sh -c 'nslookup payments.internal; wget -qO- -T3 http://payments.internal/healthz'

# 4. Credentials, which fail on a calendar rather than on a deploy.
kubectl get secret payments-client -o jsonpath='{.metadata.annotations}'
What follows is predictable. Asked why a pod is unhealthy, the assistant blames the application, because the application's log is the only witness it interviewed. It suggests a memory increase for a node problem, or a retry for a DNS problem. Those suggestions are not stupid — they are the best inference available from the evidence it had, which is precisely why the operator has to bring evidence it did not have.
Confident, wrong, and holding the restart button
The part of this category I would treat most carefully is that the newer assistants act as well as explain. Heli Crew is described as deploying, restarting, checking logs and debugging from chat, and redeploy now is one of its advertised prompts. A wrong diagnosis that produces a sentence costs you a minute. A wrong diagnosis with a restart attached to it costs you the evidence, because the previous container's log is where the cause was written and every restart pushes it one generation further away.
- It answers in the same confident register whether the evidence is a stack trace or a guess, and nothing in the reply distinguishes the two.
- It blames your application for a platform fault, because your application's log is the only witness it interviewed.
- Its summary is a lossy compression of the logs, and the line it dropped may be the line you needed.
- It can act on its own diagnosis, and a restart issued on a wrong cause deletes the log generation that held the right one.
Before you let an assistant restart anything, capture the previous container's log yourself. The --previous flag on kubectl logs reads the copy from before the last restart, and that is the only place the original failure was recorded. A restart on top of a restart puts it out of reach for good.
A triage sequence with the assistant in the middle
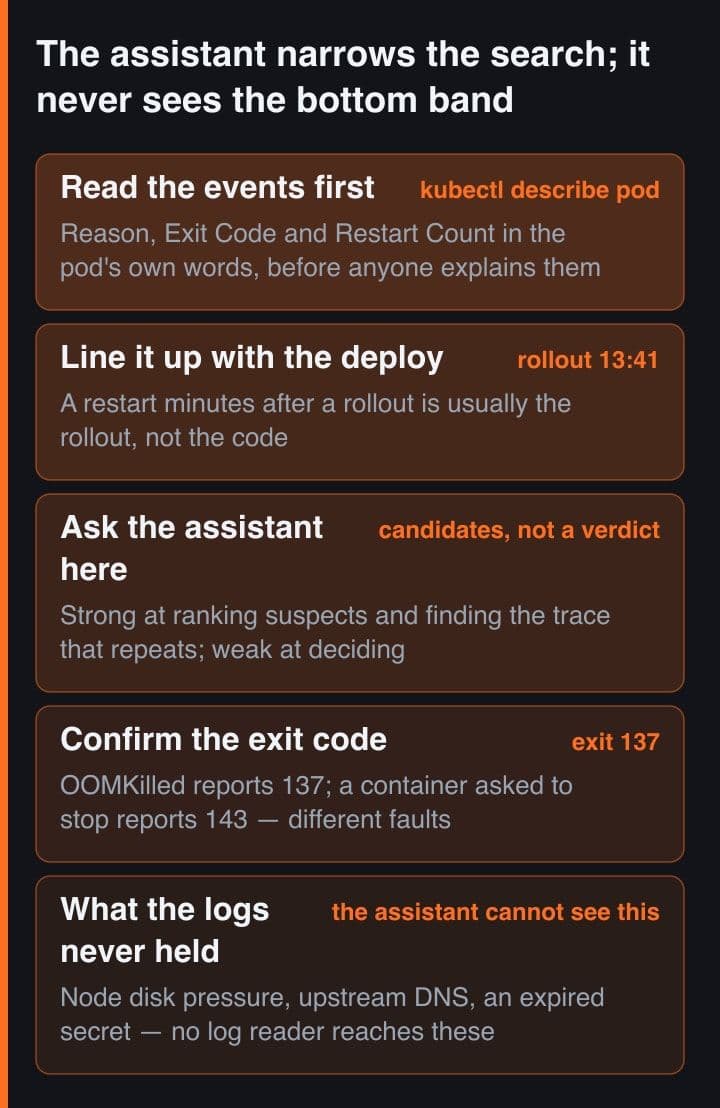
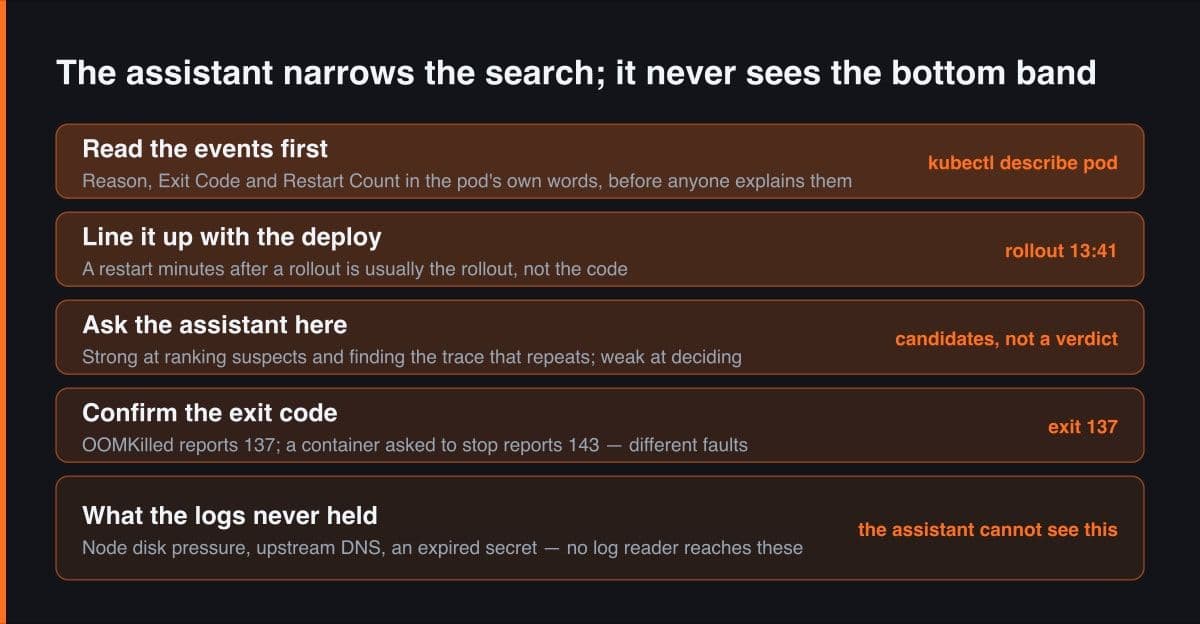
This is the order I follow, and the only rule that really matters is that the assistant is neither the first step nor the last. It comes after the raw evidence, because a model that has read the events beats one guessing from a question, and before the action, because an action needs a confirmed cause.
- Establish what changed. Rollout history and the image tag actually running answer that in two commands, and a deploy is both the likeliest cause and the cheapest to rule out.
- Read the events yourself: Reason, Exit Code and Restart Count, in the pod's own words, before anyone explains them to you.
- Ask the assistant now, with the events and the previous container's log in the prompt, and ask for ranked candidates rather than a cause.
- Test its top candidate against evidence it never saw — node conditions, cluster-wide events, name resolution from inside the namespace, the age of the secret.
- Act, then write the exit code and the confirmed cause into the incident note. That note is what makes the second occurrence a two-minute job.
# 1  What changed. Most common cause, cheapest to rule out, and the one
#    question the assistant answers well — so ask it here, not for a verdict.
kubectl rollout history deployment/checkout
kubectl get pod -l app=checkout -o jsonpath='{.items[*].spec.containers[*].image}'

# 2  What the cluster saw, in its own words, before anyone explains it.
kubectl describe pod -l app=checkout \
  | grep -E 'Reason:|Exit Code:|Restart Count:|Readiness probe'

# 3  Now ask the assistant. Give it the events and the previous container's
#    log, and ask for RANKED CANDIDATES with the line each one rests on.

# 4  Test its top candidate against something it did not read.
#    "out of memory"    -> kubectl top pod, plus the container's own limits
#    "bad config"       -> kubectl get configmap/secret, and the mounted value
#    "upstream is down" -> resolve and curl the dependency from the namespace

# 5  Only now act, and record the exit code in the incident note. Next time,
#    "137 again, same node" is the fastest sentence you own.
kubectl rollout undo deployment/checkout
Steps two and four are the ones people drop, and they are the two that keep the assistant honest. Step two gives it real evidence to reason over instead of a question; step four is the only thing standing between a plausible sentence and a production change made on the strength of it.
The rule I would give anyone adopting one of these assistants is narrow: let it tell you where to look, never what to conclude. It is a very good index into a log stream and a very good translator of Kubernetes vocabulary, and it is structurally blind to the node, the network and the calendar. Read the events, confirm the exit code, and let the chat window be the step that saves you the scrolling.
Sources
- Kubernetes — Assign Memory Resources to Containers, showing reason OOMKilled with exitCode 137
- Kubernetes — Pod Lifecycle: CrashLoopBackOff, restart backoff and the SIGTERM stop signal
- Kubernetes — Liveness, Readiness and Startup Probes
- signal(7), Linux manual page: SIGKILL is signal 9 and SIGTERM is signal 15
- Helipod — Heli Crew, the platform's AI DevOps assistant and its advertised prompts