

Key Takeaway
On a managed PaaS there is no SSH, so production debugging depends entirely on what the running process writes to stdout. Log one JSON object per line, carry a correlation ID through every service, flush the stream before the process exits, and ship a copy off-platform, because none of that can be added during an incident.
At 02:40 on a Tuesday, the approval endpoint of an ERP API started returning 500 to exactly one customer and nobody else. My first move was muscle memory: open a terminal, ssh into the box, tail the log file. There was no box. The service runs on a managed platform, and the only thing between me and the failure was a browser tab streaming lines from four pods at once, none of them labelled.
I found it eventually, and the slow part was entirely my own doing, months earlier, in code. This post is what I changed afterwards: the logger configuration, the correlation ID, the buffering behaviour that ate the last line before a crash, and the checklist that has to be true before the pager goes off. The platform details come from deploying a NestJS ERP API and a Next.js front end to Helipod, an Indonesian PaaS that runs on Kubernetes and offers browser log streaming and terminal access rather than SSH.
What you actually lose when SSH goes away
The loss is not the shell. It is history and search. A shell is only a way to reach state, and on a healthy pod the platform's web terminal gives that back. What no managed platform hands you again is the log file: a durable, seekable, greppable artefact that outlives the process which wrote it. A live stream is a tail, and a tail is only evidence if someone was watching.
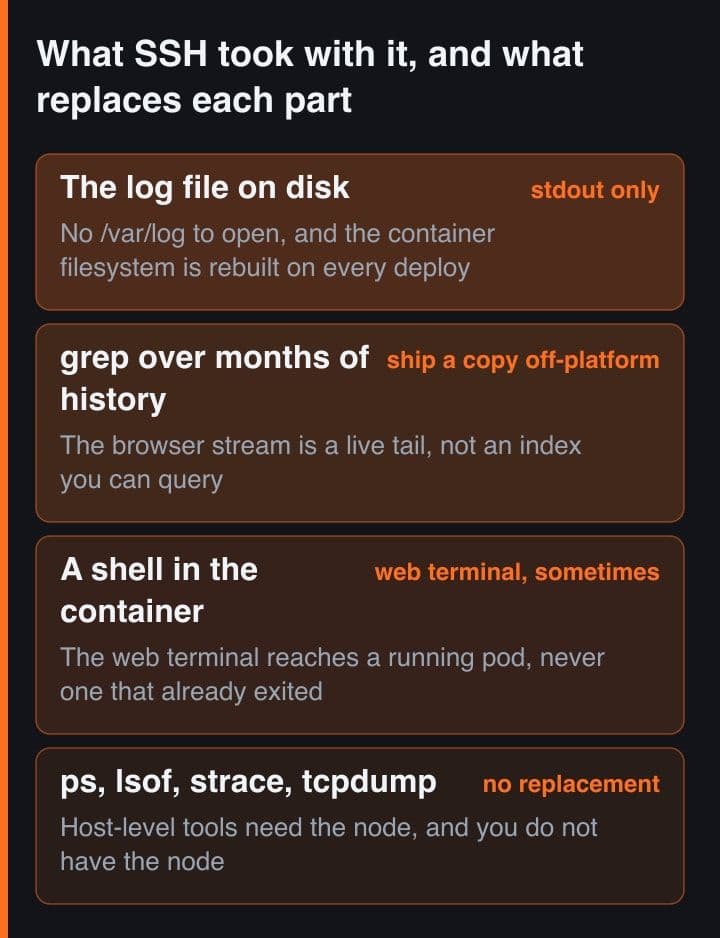
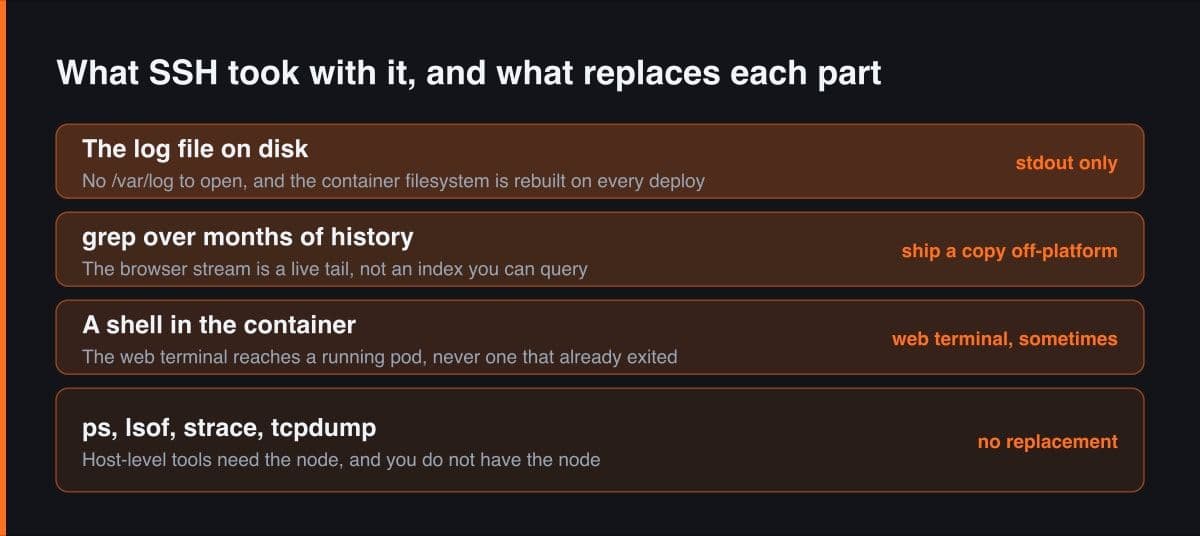
- The file on disk. There is no /var/log to open, and the container filesystem is rebuilt from the image on every deploy.
- grep, awk and less over months of history. The browser stream is a live tail over a recent window, not an index you can query.
- A shell inside a container that has already exited. The web terminal attaches to a running pod, and a crashing pod spends most of its life not running.
- Host-level tools. ps, lsof, strace and tcpdump all need the node, and on a managed platform you do not have the node.
I would not go back. Removing SSH removed a whole category of work: no keys to rotate, no bastion, no fail2ban, no server that quietly drifts away from its own Dockerfile. But every one of those four losses is now paid for in advance, in application code, or it is not paid for at all. That is the real change, and it is the part that is easy to discover at the worst possible moment.
One JSON object per line, or the stream is unreadable
A line-oriented stream is only as searchable as its lines are self-describing. When four replicas write into one stream, the thing that makes a line useful is that it carries its own context: who wrote it, from which build, for which request. Newline-delimited JSON gives you that, one complete object per line, and it is what every log backend parses without configuration and what jq reads straight out of a downloaded file. This is the pino configuration I now copy into every service.
// logger.ts - the only thing in this service allowed to write to stdout.
import pino from "pino";

export const logger = pino({
  level: process.env.LOG_LEVEL ?? "info",
  // Keep the NUMERIC level: pino routes per-target on it and jq compares it.
  // levelName is the extra field, for the human doing a plain-text search.
  formatters: {
    level: (label, number) => ({ level: number, levelName: label }),
  },
  timestamp: pino.stdTimeFunctions.isoTime,
  base: {
    service: "erp-api",
    env: process.env.NODE_ENV,
    // The git SHA the image was built from. Without it you cannot tell
    // whether the line you are reading came from the build you just shipped.
    release: process.env.GIT_SHA,
  },
  // Paths, not guesses. NIK is an Indonesian national ID number and must
  // never reach a log aggregator you do not own.
  redact: [
    "req.headers.authorization",
    "req.headers.cookie",
    "body.password",
    "customer.nik",
  ],
  // One line per error, stack included as a string field - see below.
  serializers: { err: pino.stdSerializers.err },
});| Field | Example value | What it buys you at 3am |
|---|---|---|
| time | 2026-09-25T02:40:11.418Z | Orders one story when four pods interleave into one stream |
| level | 50 | Filters the stream down to errors without reading any of it |
| service | erp-api | Says which of your apps wrote the line, before you guess |
| release | a1c9f2e | Answers whether the fix you just shipped is even running yet |
| traceId | 0af7651916cd43dd8448eb211c80319c | Joins this line to the other services that served the request |
The field I had to argue myself into was release. Half of my slow incidents were slow because I could not tell whether the log line in front of me came from the build with the bug or the build with the fix, and I was reading a stream from a rolling deploy where both were live at once. A seven-character git SHA in every line settles that in one jq command instead of ten minutes of squinting at timestamps.
A multi-line stack trace is the enemy of a line-oriented stream
In a stream where the record separator is a newline, an event that spans twelve lines is twelve events. The runtime records each line as its own entry and the platform ships them independently, so under load the frames of your stack trace arrive interleaved with unrelated output from two other replicas. Worse, a backend that indexes per line puts the error message and the frame naming your own file into different search results, which is exactly the join you needed.
// Wrong: the message goes out, then the stack goes out as its own lines.
// The platform records 12 events, none of which carry the request id.
catch (e) {
  console.error("approval failed", e);
}
// approval failed
// Error: connect ETIMEDOUT 10.42.0.19:5432
//     at TCPConnectWrap.afterConnect [as oncomplete] (node:net:1611:16)
//     ... nine more frames, interleaved with two other pods under load

// Right: one event, one line. The stack is a string field inside it.
catch (err) {
  logger.error({ err, approvalId: payload.id, step: "post" }, "approval failed");
}
// Wrapped here for the page; on the wire it is a single line:
// {"level":50,"levelName":"error","time":"2026-09-25T02:40:11.418Z",
//  "service":"erp-api","release":"a1c9f2e","traceId":"0af7651916cd43dd...",
//  "err":{"type":"Error","message":"connect ETIMEDOUT 10.42.0.19:5432",
//         "stack":"Error: connect ETIMEDOUT ... at TCPConnectWrap ..."},
//  "approvalId":"AP-90412","step":"post","msg":"approval failed"}
The rule that followed was blunter than I expected: nothing writes to stdout except the logger. A console.log anywhere in the codebase produces a line with no service, no release and no trace id, and it is indistinguishable from noise. I made it a lint error, routed the few legitimate cases through logger.info, and left third-party libraries that print as the one known exception I check for after every dependency bump.
A correlation ID is the only thing that joins four streams
The failure the customer saw was one request. The evidence was spread across four pods and two services. Without an identifier that every line carries, reassembling that means matching timestamps produced by different processes, which is guesswork dressed as method. The W3C Trace Context recommendation already defines the wire format: a traceparent header of version, trace-id, parent-id and flags, where trace-id is a 16-byte array written as 32 lowercase hex characters and all zeroes is invalid. Using the standard means gateways, proxies and tracing vendors propagate it for you.
// request-context.ts - one id per request, carried without threading it
// through every function signature in the codebase.
import { AsyncLocalStorage } from "node:async_hooks";
import { randomBytes } from "node:crypto";

type Ctx = { traceId: string; spanId: string };
export const store = new AsyncLocalStorage<Ctx>();

// W3C traceparent is version-traceid-parentid-flags, all lowercase hex:
// 00-0af7651916cd43dd8448eb211c80319c-b7ad6b7169203331-01
// trace-id is a 16-byte array, 32 hex chars, and all-zero is invalid.
function incomingTraceId(header?: string): string | null {
  const parts = (header ?? "").split("-");
  const id = parts[1] ?? "";
  return parts.length === 4 && id.length === 32 && !/^0+$/.test(id) ? id : null;
}

app.use((req, res, next) => {
  const traceId =
    incomingTraceId(req.header("traceparent")) ?? randomBytes(16).toString("hex");
  const spanId = randomBytes(8).toString("hex");
  // Hand it back, so a user can quote it in a support message and you can
  // find the request without knowing exactly when it happened.
  res.setHeader("x-trace-id", traceId);
  store.run({ traceId, spanId }, next);
});

// Every line now carries it, with no argument passing anywhere.
const logger = pino({ mixin: () => store.getStore() ?? {} });

// And it has to leave the process again, or the id dies at the first hop.
await fetch(paymentsUrl, {
  headers: {
    traceparent: "00-" + ctx.traceId + "-" + ctx.spanId + "-01",
  },
});
The trap is the outbound half. It is easy to accept the header, log the id happily for the whole request, and then call the payments service with a bare fetch, at which point the id stops dead at the first hop and the second service's lines are anonymous again. Whatever HTTP client wrapper you use, put the propagation inside it, because the one call site that forgets is the one in the incident.
Buffering is the trap that hides the line you need
The most expensive missing line is the one the process never finished writing. The Node.js documentation is explicit that writes to process.stdout may be synchronous or asynchronous depending on what the stream is connected to: files are synchronous on Windows and POSIX, TTYs are synchronous on POSIX, and pipes and sockets are asynchronous on POSIX. In a container your stdout is a pipe on Linux, so it is the asynchronous case. The same page notes that synchronous writes exist partly to avoid output not being written at all if process.exit is called before an asynchronous write completes, and the process.exit documentation says it forces the process to exit as quickly as possible even when I/O operations to stdout and stderr are still pending.
Then your logger adds a second layer. Pino's asynchronous mode buffers deliberately, writing in larger chunks once minLength bytes have accumulated, and its own documentation states the caveat plainly: the most recently buffered messages may be lost in the event of a system failure. Both layers behave correctly. Together they mean that the classic fatal handler, which logs and then exits immediately, is the exact shape that discards the only line that would have explained the crash.
// Wrong: logger.fatal returns before the bytes have left the process, and
// exit() discards pending stdout writes. The one line that explained the
// crash is the one you never see.
process.on("uncaughtException", (err) => {
  logger.fatal({ err }, "uncaught, crashing");
  process.exit(1);
});

// Right: flush first, exit inside the callback.
process.on("uncaughtException", (err) => {
  logger.fatal({ err }, "uncaught, crashing");
  logger.flush(() => process.exit(1));
});

// Better for the fatal path: a synchronous destination, so the write has
// completed before the next statement runs. It blocks the event loop, which
// is exactly what you want in a process that is about to stop existing.
const fatalLogger = pino(pino.destination({ dest: 1, sync: true }));

// Ordinary shutdown: do not call exit at all. A rolling deploy sends SIGTERM,
// and the loop drains by itself once the server is closed.
process.on("SIGTERM", async () => {
  await server.close();
  process.exitCode = 0;
});
The fatal handler that calls process.exit right after logger.fatal is the single most common way to lose the evidence you most need. It is also invisible in development, where stdout is usually a TTY and therefore synchronous on POSIX. The behaviour only changes when you put the process in a container, which is to say when it starts mattering.
Retention, and the pod that died before anyone looked
A stream you are not recording is not observability. Kubernetes' own logging documentation says it directly: logs should have a storage and lifecycle independent of nodes, pods and containers, and Kubernetes provides no native storage solution for log data. Underneath, the kubelet rotates container logs using containerLogMaxSize, which defaults to 10Mi, and containerLogMaxFiles, which defaults to 5. That ceiling is a size, not a duration, so a chatty pod can roll past the evidence in minutes while a quiet one keeps a week of it. Neither of those is a retention policy you chose.
- Warn and above leaves the platform immediately, to storage whose retention you picked deliberately.
- Info is sampled rather than dropped, because request-rate context is what makes an error line readable later.
- Debug never leaves the pod, and is switched on per service through an environment variable when you need it.
- Anything an auditor may ask about is not a log at all. It is a row in the ERP's own audit table, in Postgres, where it can be joined to the order it describes.
# The exported stream is newline-delimited JSON, so jq is the whole triage
# kit. Keep these three in the runbook, not in your head at 03:00.

# 1. Everything that happened to ONE request, across every service.
jq -c 'select(.traceId == "0af7651916cd43dd8448eb211c80319c")' stream.ndjson

# 2. Errors and worse, as a table you can read. In pino's numeric scale
#    error is 50 and fatal is 60.
jq -r 'select(.level >= 50) | [.time, .service, .release, .msg] | @tsv' stream.ndjson

# 3. Which release produced them. This ends more incidents than any other
#    single command, because the answer is usually the deploy from 20:00.
jq -r 'select(.level >= 50) | .release' stream.ndjson | sort | uniq -c | sort -rn
The last point is the one people push back on, so to be precise about the trade: logs are for diagnosis and they are allowed to be lossy, sampled and eventually deleted. An approval history is a business record. Storing it only in a log stream means its retention is decided by whichever pod happened to be chatty that week, and that is not a decision anyone would make on purpose.
A browser log stream is a tail with a scrollback, not a search index - Helipod's, for instance, arrives over server-sent events. Learn the export path on a quiet afternoon, download one real stream, and put a working jq filter in the runbook. Discovering the export button for the first time during an incident costs you the first ten minutes, which are the cheapest ten minutes you will get.
What the web terminal is for, and what it is not
The web terminal answers exactly one class of question well: is the world what I think it is, inside a pod that is currently alive. That is a genuinely useful class, and it covers most of what I used SSH for on a healthy server.
- Read the environment the process actually received, which is not always what the dashboard shows you it should have.
- Resolve an internal service name and curl its health endpoint from inside the cluster network, where your laptop cannot reach.
- List the filesystem the build actually produced, which settles most arguments about a missing asset or a wrong working directory.
- Check the container's clock and timezone before you spend an hour on timestamps that were never wrong.
What it is not: a way into a pod that has already exited, because there is no process to attach to and a crash-looping container is not running when you get there. It is also not a place to fix anything. The container filesystem is rebuilt from the image on the next deploy, and any replica the autoscaler adds afterwards never saw your edit. I have watched a change made in a web terminal work perfectly until the platform scaled to a second pod, at which point half the traffic met the original bug again and the evidence of the fix existed nowhere.
The pre-incident checklist
None of these can be added while you are being paged. Each of them is under an hour of work on a calm afternoon, and each one has, at some point, been the difference between a ten-minute incident and a three-hour one for me.
- Every line is a single JSON object, written by one logger, and console.log is a lint error rather than a habit.
- Errors are serialised into that one line, with the stack as a string field, never printed as their own block of text.
- A trace id enters at the edge from traceparent, is generated when absent, is returned to the caller in a response header, and is forwarded on every outbound call.
- Every line carries service, environment and the release SHA, so no line is ever anonymous.
- The fatal path flushes before exiting, and ordinary shutdown sets process.exitCode instead of calling process.exit.
- Warn and above is shipped off-platform to storage with a retention you chose, not to whatever the platform happens to keep.
- You have exported the stream once, on a quiet day, and the jq filters that read it live in the runbook rather than in your memory.
The checklist has never felt urgent. It has also never taken more than a day, and the day is always cheaper than the incident, because during the incident the code is frozen and whatever the process is writing is all the information that exists.
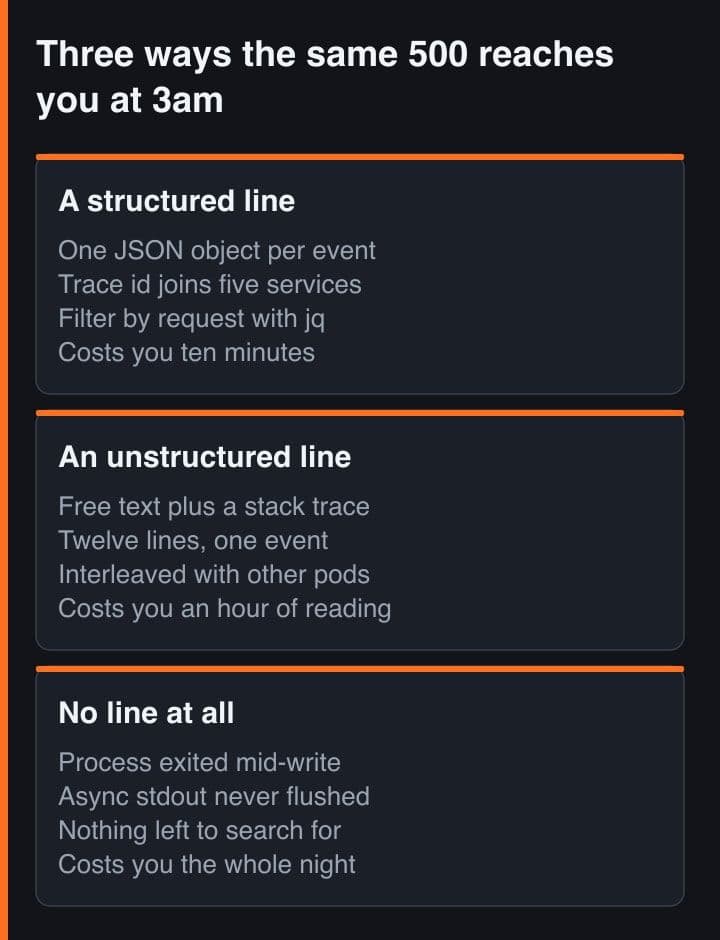
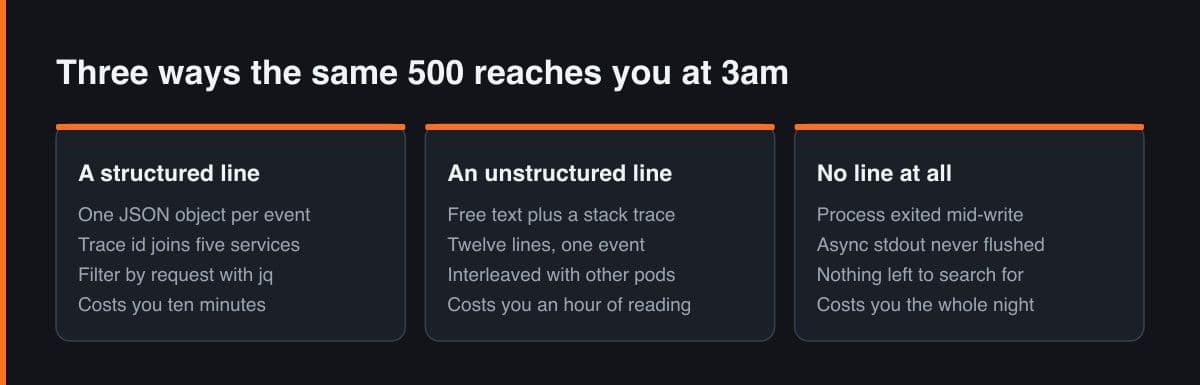
Losing SSH did not make production harder to debug. It made the quality of my logging the only variable that matters, which was uncomfortable, because that variable was previously hidden behind a shell I could always fall back on. The rule I use now, before a service is allowed near production traffic: describe what its worst line will look like at 3am. If the answer is free text from an anonymous pod, the service is not finished yet.
Sources and further reading
- Node.js documentation - process.stdout, process.exit and the note on process I/O
- Pino documentation - asynchronous logging, buffering and logger.flush
- W3C Trace Context Recommendation - the traceparent header format
- Kubernetes documentation - logging architecture, log rotation and cluster-level logging
- Helipod - browser log streaming and terminal access without SSH keys