

DevOps
Load Testing Node.js APIs with k6 and Grafana Dashboards
August 202610 min read
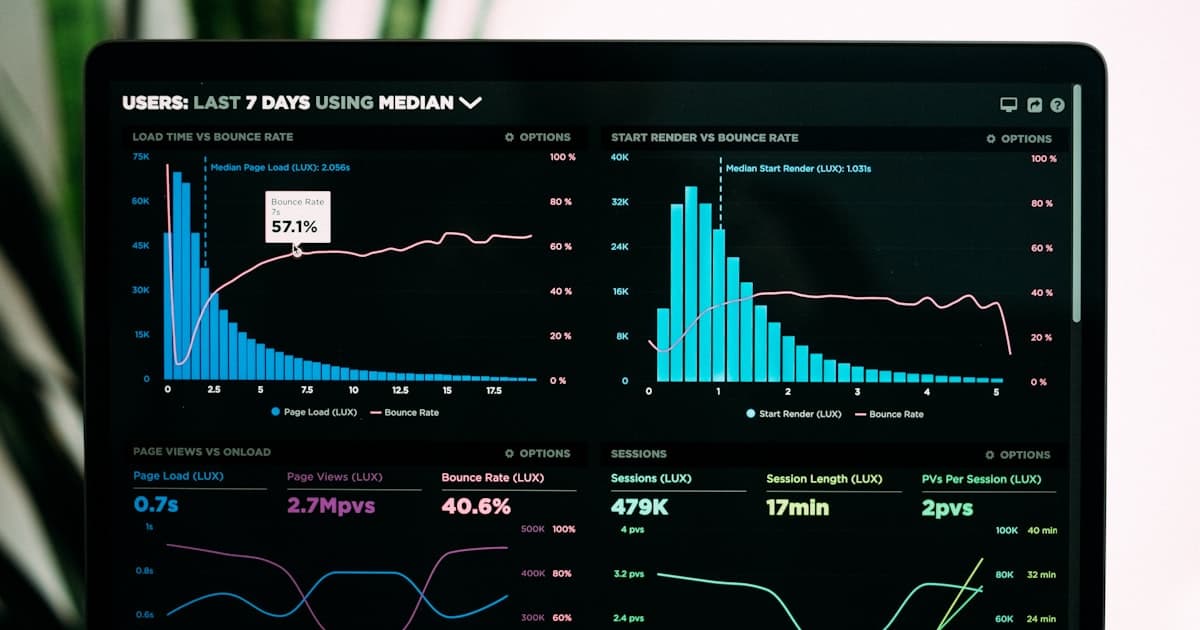
Photo by Luke Chesser on Unsplash
k6 is an open-source load-testing tool from Grafana Labs. You write test scripts in JavaScript that simulate virtual users hitting an API, run them from the command line, and measure latency, throughput, and error rate under load. It is commonly used to gate CI pipelines and to find how much traffic an API can handle before it degrades.
A threshold is an expression over a metric, such as http_req_duration p(95) below 300ms or http_req_failed rate below 0.01, that must hold at the end of a test. If it evaluates to false, k6 exits with a non-zero code, which any CI runner treats as a failed step. Adding abortOnFail stops the run the moment a threshold is breached.
A smoke test uses minimal VUs to confirm the script and system work. An average-load test runs expected production traffic. A stress test pushes above the expected peak. A soak test holds average load for hours to expose leaks. A spike test throws a sudden, massive surge to check survival and recovery.
Run k6 with the experimental Prometheus remote-write output: k6 run -o experimental-prometheus-rw script.js. Point it at a Prometheus endpoint via K6_PROMETHEUS_RW_SERVER_URL (default http://localhost:9090/api/v1/write), set K6_PROMETHEUS_RW_TREND_STATS for the percentiles you want, then import Grafana Labs' ready-made k6 Prometheus dashboard to watch metrics live.
A Node.js API serves queries through a fixed-size connection pool. Below the pool size latency stays flat, but once concurrent in-flight queries exceed it, requests queue for a free connection. That queue time appears as a sharp climb in p(95) and p(99) latency while error rate looks fine. Ramping VUs upward exposes that knee in the curve as your pool ceiling.
Photo by Luke Chesser on Unsplash
Key Takeaway
k6 is a JavaScript load-testing tool that scripts virtual users hitting an API, ramps them through stages, and enforces thresholds as pass or fail gates in CI. Streaming its metrics to Prometheus via remote write and charting them in Grafana turns a run into a live dashboard, exposing the database connection-pool ceiling where latency suddenly climbs.
Every API I ship eventually gets asked the same question in an incident review: how many concurrent users can it actually take before it falls over? Guessing is not an answer. Load testing turns that guess into a number you can defend, and k6 is the tool I reach for because the tests are plain JavaScript, they run from the command line, and they fail a CI pipeline the moment performance regresses.
k6 is an open-source load-testing tool maintained by Grafana Labs. You write a script that describes what one virtual user does, tell k6 how many virtual users to run and for how long, and it replays that behaviour under load while recording latency, throughput, and error rate. In this post I walk through writing a test, gating a pipeline on thresholds, choosing the right test profile, streaming results to Grafana, and using all of that to find the point where a database connection pool becomes the bottleneck.
A k6 script has two parts: an exported options object that configures the run, and a default function that is the code each virtual user executes in a loop. A virtual user, or VU, is one simulated concurrent client. The options object is where you decide how many VUs run and how the count changes over time.
The stages array is the most useful way to shape a run. Each entry is a target VU count and a duration, and k6 ramps the active VU count linearly toward that target over that period. It is a shortcut for the ramping-VUs executor. The script below warms up to 50 VUs, holds, pushes to 100, holds again, then ramps back down.
import http from 'k6/http';
import { check, sleep } from 'k6';

export const options = {
  // A ramping-VUs profile: warm up, hold, push higher, ramp down.
  stages: [
    { duration: '1m', target: 50 },
    { duration: '3m', target: 50 },
    { duration: '1m', target: 100 },
    { duration: '3m', target: 100 },
    { duration: '1m', target: 0 },
  ],
  // Thresholds are the pass/fail contract. Any breach = non-zero exit.
  thresholds: {
    http_req_failed: ['rate<0.01'],            // < 1% of requests may error
    http_req_duration: ['p(95)<300', 'p(99)<800'], // ms
    checks: ['rate>0.99'],                     // > 99% of checks must pass
  },
};

export default function () {
  const res = http.get('https://api.example.com/orders');
  check(res, {
    'status is 200': (r) => r.status === 200,
    'body is not empty': (r) => r.body.length > 0,
  });
  sleep(1);
}
Inside the default function, http.get fires the request and check runs assertions against the response. Checks never fail the test on their own; they only record a pass or fail rate. The sleep call models think time between requests so the VUs behave a little more like real users instead of a tight hammering loop.
Keep the default function small and focused on one user journey. If you need to model several journeys with different weights, use named scenarios and executors instead of cramming branching logic into one function. One scenario per journey keeps the metrics clean and the results readable.
Thresholds are what make k6 useful in a pipeline. Each threshold is an expression over a metric that must hold at the end of the run; if it evaluates to false, k6 exits with a non-zero code and the pipeline step fails. The expression follows an aggregation, operator, value shape — for example a 95th-percentile latency below a limit, or an error rate below a ceiling. The metrics I gate on most often are these three.
By default a threshold is only evaluated once, at the end of the test. Add abortOnFail to a threshold and k6 stops the run the instant it is breached, which saves minutes on an obviously failing build; delayAbortEval gives the run a grace period to collect data before enforcement kicks in. Because a failed threshold is a non-zero exit code, no extra glue is needed — GitHub Actions, GitLab CI, or Jenkins already treat that as a failed step.
The same script becomes a different test depending on how you set the VUs and duration. Grafana documents a small family of test types, each answering a different question. I keep a smoke test in every pipeline and run the heavier profiles on a schedule or before a big release.
| Profile | Load and duration | What it reveals |
|---|---|---|
| Smoke | Minimal VUs, seconds to minutes | The script works and the system is healthy under trivial load — a cheap sanity gate for CI. |
| Average-load | Expected production VUs, 5 to 60 minutes | Whether the system holds normal performance under typical everyday traffic. |
| Stress | Above-average VUs, 5 to 60 minutes | How the system behaves past its expected peak, and how gracefully it degrades. |
| Soak | Average VUs, several hours | Reliability over time — memory leaks, connection exhaustion, and slow resource drift. |
| Spike | Very high VUs, a few minutes | Survival and recovery when traffic surges suddenly and then drops away. |
k6 prints a summary when a run ends, but the interesting story is what happens during the run. The experimental Prometheus remote-write output streams every metric to a Prometheus instance in real time, so you can watch latency climb live on a Grafana dashboard. You point k6 at a remote-write endpoint with an environment variable and add the output flag.
# Point k6 at a Prometheus endpoint that accepts remote write.
# Default target is http://localhost:9090/api/v1/write
export K6_PROMETHEUS_RW_SERVER_URL=http://localhost:9090/api/v1/write

# Ship percentiles, not just the p(99) default, so dashboards are useful.
export K6_PROMETHEUS_RW_TREND_STATS="p(95),p(99),min,max"

# Stream every metric to Prometheus in real time as the test runs.
k6 run -o experimental-prometheus-rw load-test.js
By default k6 sends only the p(99) for trend metrics; setting K6_PROMETHEUS_RW_TREND_STATS to a list like p(95),p(99),min,max ships the percentiles a dashboard needs. Grafana Labs publishes ready-made k6 Prometheus dashboards you can import, so you get panels for request rate, error rate, and latency percentiles without building them by hand. For the highest fidelity you can enable native histograms, which requires a recent Prometheus with that feature turned on.
The Prometheus remote-write output is still marked experimental, and the flag name reflects that: k6 run -o experimental-prometheus-rw. Pin your k6 version in CI so an upgrade does not silently rename the flag or change defaults mid-project, and confirm your Prometheus actually has the remote-write receiver enabled before you blame k6 for missing data.
This is where load testing earns its keep. A Node.js API usually talks to its database through a fixed-size connection pool. Below the pool size, extra concurrency mostly just uses idle connections and latency stays flat. Once concurrent in-flight queries exceed the pool, new requests queue waiting for a free connection, and that queue time shows up as a sharp, sudden climb in p(95) and p(99) — even though CPU and error rate still look fine.
A stress or breakpoint profile makes that ceiling visible. Ramp VUs steadily upward and watch the latency percentiles on the Grafana dashboard: the knee in the curve, where latency turns from flat to a steep line while throughput stops rising, is your pool ceiling. From there you either raise the pool size, add read replicas, or shorten the queries — but now the decision is driven by a measured breaking point, not a hunch. The database, not k6 or Node, is usually the real limit.
My rule of thumb: a smoke test on every pull request as a fast gate, a load test with real thresholds before each release, and an occasional soak or stress run streamed to Grafana when I need to size infrastructure. The script barely changes between them — only the VUs, duration, and thresholds do. Start with one endpoint, gate it on a p(95) threshold, and let a red pipeline teach you where your API actually breaks.